Developer Guide

An introduction to application development tools in Red Hat Enterprise Linux 6

Edition 0

Link to Original Document

Edited by

Don Domingo

Red Hat Engineering Content Services

Edited by

Jacquelynn East

Red Hat Engineering Content Services

Red Hat Subject Matter Experts

Dave Brolley

Profiling 
Red Hat Engineering Tools Development

William Cohen

Profiling 
Red Hat Engineering Tools Development

Roland Grunberg

Eclipse and Eclipse plug-ins 
Red Hat Engineering Tools Development

Aldy Hernandez

Compiling and Building 
Red Hat Engineering Tools Development

Karsten Hopp

Compiling 
Base Operating System Core Services - BRNO

Jakub Jelinek

Profiling 
Red Hat Engineering Tools Development

Jeff Johnston

Eclipse and Eclipse plug-ins 
Red Hat Engineering Tools Development

Benjamin Kosnik

Libraries and Runtime Support 
Red Hat Engineering Tools Development

Aleksander Kurtakov

Eclipse and Eclipse plug-ins 
Red Hat Engineering Tools Development

Chris Moller

Debugging 
Red Hat Engineering Tools Development

Phil Muldoon

Debugging 
Red Hat Engineering Tools Development

Andrew Overholt

Eclipse and Eclipse plug-ins 
Red Hat Engineering Tools Development

Charley Wang

Eclipse and Eclipse plug-ins 
Red Hat Engineering Tools Development

Development Community

Kent Sebastian

Profiling 

Legal Notice

Copyright © 2010 Red Hat, Inc. and others.
The text of and illustrations in this document are licensed by Red Hat under a Creative Commons Attribution–Share Alike 3.0 Unported license ("CC-BY-SA"). An explanation of CC-BY-SA is available at http://creativecommons.org/licenses/by-sa/3.0/. In accordance with CC-BY-SA, if you distribute this document or an adaptation of it, you must provide the URL for the original version.
Red Hat, as the licensor of this document, waives the right to enforce, and agrees not to assert, Section 4d of CC-BY-SA to the fullest extent permitted by applicable law.
Red Hat, Red Hat Enterprise Linux, the Shadowman logo, JBoss, MetaMatrix, Fedora, the Infinity Logo, and RHCE are trademarks of Red Hat, Inc., registered in the United States and other countries.
Linux® is the registered trademark of Linus Torvalds in the United States and other countries.
Java® is a registered trademark of Oracle and/or its affiliates.
XFS® is a trademark of Silicon Graphics International Corp. or its subsidiaries in the United States and/or other countries.
MySQL® is a registered trademark of MySQL AB in the United States, the European Union and other countries.
All other trademarks are the property of their respective owners.


1801 Varsity Drive
 RaleighNC 27606-2072 USA
 Phone: +1 919 754 3700
 Phone: 888 733 4281
 Fax: +1 919 754 3701

Abstract
This document describes the different features and utilities that make Red Hat Enterprise Linux 6 an ideal enterprise platform for application development. It focuses on Eclipse as an end-to-end integrated development environment (IDE), but also includes command-line tools and other utilities outside Eclipse.

Preface
1. Document Conventions
1.1. Typographic Conventions
1.2. Pull-quote Conventions
1.3. Notes and Warnings
2. Getting Help and Giving Feedback
2.1. Do You Need Help?
2.2. We Need Feedback!
1. Introduction to Eclipse
1.1. Understanding Eclipse Projects
1.2. Help In Eclipse
1.3. Development Toolkits
2. The Eclipse Integrated Development Environment (IDE)
2.1. User Interface
2.2. Useful Hints
2.2.1. The quick access menu
2.2.2. libhover Plug-in
3. Libraries and Runtime Support
3.1. Version Information
3.2. Compatibility
3.2.1. API Compatibility
3.2.2. ABI Compatibility
3.2.3. Policy
3.2.4. Static Linking
3.3. Library and Runtime Details
3.3.1. The GNU C Library
3.3.2. The GNU C++ Standard Library
3.3.3. Boost
3.3.4. Qt
3.3.5. KDE Development Framework
3.3.6. Python
3.3.7. Java
3.3.8. Ruby
3.3.9. Perl
4. Compiling and Building
4.1. GNU Compiler Collection (GCC)
4.1.1. GCC Status and Features
4.1.2. Language Compatibility
4.1.3. Object Compatibility and Interoperability
4.1.4. Backwards Compatibility Packages
4.1.5. Previewing RHEL6 compiler features on RHEL5
4.1.6. Running GCC
4.1.7. GCC Documentation
4.2. Distributed Compiling
4.3. Autotools
4.3.1. Autotools Plug-in for Eclipse
4.3.2. Configuration Script
4.3.3. Autotools Documentation
4.4. Eclipse Built-in Specfile Editor
5. Debugging
5.1. Installing Debuginfo Packages
5.2. GDB
5.2.1. Simple GDB
5.2.2. Running GDB
5.2.3. Conditional Breakpoints
5.2.4. Forked Execution
5.2.5. Threads
5.2.6. GDB Variations and Environments
5.2.7. GDB Documentation
5.3. Variable Tracking at Assignments
5.4. Python Pretty-Printers
6. Profiling
6.1. Profiling In Eclipse
6.2. Valgrind
6.2.1. Valgrind Tools
6.2.2. Using Valgrind
6.2.3. Valgrind Plug-in for Eclipse
6.2.4. Valgrind Documentation
6.3. OProfile
6.3.1. OProfile Tools
6.3.2. Using OProfile
6.3.3. OProfile Plug-in For Eclipse
6.3.4. OProfile Documentation
6.4. SystemTap
6.4.1. SystemTap Compile Server
6.4.2. SystemTap Support for Unprivileged Users
6.4.3. SSL and Certificate Management
6.4.4. SystemTap Documentation
6.5. Eclipse-Callgraph
6.5.1. Launching a Profile With Eclipse-Callgraph
6.5.2. The Callgraph View
6.6. Performance Counters for Linux (PCL) Tools and perf
6.6.1. Perf Tool Commands
6.6.2. Using Perf
6.7. ftrace
6.7.1. Using ftrace
6.7.2. ftrace Documentation
A. Revision History
Index

Preface

This book describes the some of the more commonly-used programming resources in Red Hat Enterprise Linux 6. Each phase of the application development process is described as a separate chapter, enumerating tools that accomplish different tasks for that particular phase.
Note that this is not a comprehensive listing of all available development tools in Red Hat Enterprise Linux 6. In addition, each section herein does not contain detailed documentation of each tool. Rather, this book provides a brief overview of each tool, with a short description of updates to the tool in Red Hat Enterprise Linux 6 along with (more importantly) references to more detailed information.
In addition, this book focuses on Eclipse as an end-to-end integrated development platform. This was done to highlight the Red Hat Enterprise Linux 6 version of Eclipse and several Eclipse plug-ins.

1. Document Conventions

This manual uses several conventions to highlight certain words and phrases and draw attention to specific pieces of information.
In PDF and paper editions, this manual uses typefaces drawn from the Liberation Fonts set. The Liberation Fonts set is also used in HTML editions if the set is installed on your system. If not, alternative but equivalent typefaces are displayed. Note: Red Hat Enterprise Linux 5 and later includes the Liberation Fonts set by default.

1.1. Typographic Conventions

Four typographic conventions are used to call attention to specific words and phrases. These conventions, and the circumstances they apply to, are as follows.
Mono-spaced Bold
Used to highlight system input, including shell commands, file names and paths. Also used to highlight keycaps and key combinations. For example:
To see the contents of the file my_next_bestselling_novel in your current working directory, enter the cat my_next_bestselling_novel command at the shell prompt and press Enter to execute the command.
The above includes a file name, a shell command and a keycap, all presented in mono-spaced bold and all distinguishable thanks to context.
Key combinations can be distinguished from keycaps by the hyphen connecting each part of a key combination. For example:
Press Enter to execute the command.
Press Ctrl+Alt+F2 to switch to the first virtual terminal. Press Ctrl+Alt+F1 to return to your X-Windows session.
The first paragraph highlights the particular keycap to press. The second highlights two key combinations (each a set of three keycaps with each set pressed simultaneously).
If source code is discussed, class names, methods, functions, variable names and returned values mentioned within a paragraph will be presented as above, in mono-spaced bold. For example:
File-related classes include filesystem for file systems, file for files, and dir for directories. Each class has its own associated set of permissions.
Proportional Bold
This denotes words or phrases encountered on a system, including application names; dialog box text; labeled buttons; check-box and radio button labels; menu titles and sub-menu titles. For example:
Choose SystemPreferencesMouse from the main menu bar to launch Mouse Preferences. In the Buttons tab, click the Left-handed mouse check box and click Close to switch the primary mouse button from the left to the right (making the mouse suitable for use in the left hand).
To insert a special character into a gedit file, choose ApplicationsAccessoriesCharacter Map from the main menu bar. Next, choose SearchFind… from the Character Map menu bar, type the name of the character in the Search field and click Next. The character you sought will be highlighted in the Character Table. Double-click this highlighted character to place it in the Text to copy field and then click the Copy button. Now switch back to your document and choose EditPaste from the gedit menu bar.
The above text includes application names; system-wide menu names and items; application-specific menu names; and buttons and text found within a GUI interface, all presented in proportional bold and all distinguishable by context.
Mono-spaced Bold Italic or Proportional Bold Italic
Whether mono-spaced bold or proportional bold, the addition of italics indicates replaceable or variable text. Italics denotes text you do not input literally or displayed text that changes depending on circumstance. For example:
To connect to a remote machine using ssh, type ssh username@domain.name at a shell prompt. If the remote machine is example.com and your username on that machine is john, type ssh john@example.com.
The mount -o remount file-system command remounts the named file system. For example, to remount the /home file system, the command is mount -o remount /home.
To see the version of a currently installed package, use the rpm -q package command. It will return a result as follows: package-version-release.
Note the words in bold italics above — username, domain.name, file-system, package, version and release. Each word is a placeholder, either for text you enter when issuing a command or for text displayed by the system.
Aside from standard usage for presenting the title of a work, italics denotes the first use of a new and important term. For example:
Publican is a DocBook publishing system.

1.2. Pull-quote Conventions

Terminal output and source code listings are set off visually from the surrounding text.
Output sent to a terminal is set in mono-spaced roman and presented thus:
books        Desktop   documentation  drafts  mss    photos   stuff  svn
books_tests  Desktop1  downloads      images  notes  scripts  svgs
Source-code listings are also set in mono-spaced roman but add syntax highlighting as follows:
package org.jboss.book.jca.ex1;

import javax.naming.InitialContext;

public class ExClient
{
   public static void main(String args[]) 
       throws Exception
   {
      InitialContext iniCtx = new InitialContext();
      Object         ref    = iniCtx.lookup("EchoBean");
      EchoHome       home   = (EchoHome) ref;
      Echo           echo   = home.create();

      System.out.println("Created Echo");

      System.out.println("Echo.echo('Hello') = " + echo.echo("Hello"));
   }
}

1.3. Notes and Warnings

Finally, we use three visual styles to draw attention to information that might otherwise be overlooked.

Note

Notes are tips, shortcuts or alternative approaches to the task at hand. Ignoring a note should have no negative consequences, but you might miss out on a trick that makes your life easier.

Important

Important boxes detail things that are easily missed: configuration changes that only apply to the current session, or services that need restarting before an update will apply. Ignoring a box labeled 'Important' will not cause data loss but may cause irritation and frustration.

Warning

Warnings should not be ignored. Ignoring warnings will most likely cause data loss.

2. Getting Help and Giving Feedback

2.1. Do You Need Help?

If you experience difficulty with a procedure described in this documentation, visit the Red Hat Customer Portal at http://access.redhat.com. Through the customer portal, you can:
  • search or browse through a knowledgebase of technical support articles about Red Hat products.
  • submit a support case to Red Hat Global Support Services (GSS).
  • access other product documentation.
Red Hat also hosts a large number of electronic mailing lists for discussion of Red Hat software and technology. You can find a list of publicly available mailing lists at https://www.redhat.com/mailman/listinfo. Click on the name of any mailing list to subscribe to that list or to access the list archives.

2.2. We Need Feedback!

If you find a typographical error in this manual, or if you have thought of a way to make this manual better, we would love to hear from you! Please submit a report in Bugzilla: http://bugzilla.redhat.com/ against the product Red_Hat_Enterprise_Linux.
When submitting a bug report, be sure to mention the manual's identifier: doc-Developer_Guide
If you have a suggestion for improving the documentation, try to be as specific as possible when describing it. If you have found an error, please include the section number and some of the surrounding text so we can find it easily.

Chapter 1. Introduction to Eclipse

1.1. Understanding Eclipse Projects
1.2. Help In Eclipse
1.3. Development Toolkits
Eclipse is a powerful development environment that provides tools for each phase of the development process. It is integrated into a single, fully configurable user interface for ease of use, featuring a pluggable architecture which allows for extension in a variety of ways.
Eclipse integrates a variety of disparate tools into a unified environment to create a rich development experience. The Valgrind plug-in, for example, allows programmers to perform memory profiling (normally done through the command line) through the Eclipse user interface. This functionality is not exclusive only to Eclipse.
Being a graphical application, Eclipse is a welcome alternative to developers who find the command line interface intimidating or difficult. In addition, Eclipse's built-in Help system provides extensive documentation for each integrated feature and tool. This greatly decreases the initial time investment required for new developers to become fluent in its use.
The traditional (i.e. mostly command-line based) Linux tools suite (gcc, gdb, etc) and Eclipse offer two distinct approaches to programming. Most traditional Linux tools are far more flexible, subtle, and (in aggregate) more powerful than their Eclipse-based counterparts. These traditional Linux tools, on the other hand, are more difficult to master, and offer more capabilities than are required by most programmers or projects. Eclipse, by contrast, sacrifices some of these benefits in favor of an integrated environment, which in turn is suitable for users who prefer their tools accessible in a single, graphical interface.

1.1. Understanding Eclipse Projects

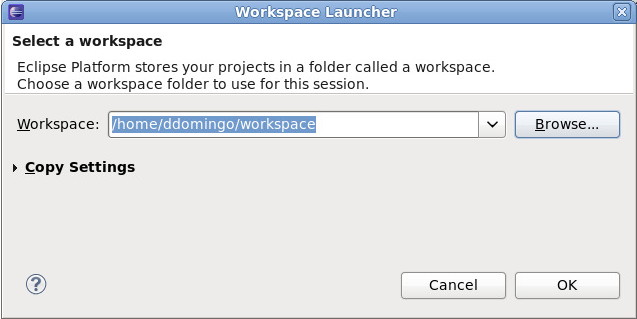
Eclipse stores all project and user files in a designated workspace. You can have multiple workspaces and can switch between each one on the fly. However, Eclipse will only be able to load projects from the current active workspace. To switch between active workspaces, navigate to File > Switch Workspace > /path/to/workspace. You can also add a new workspace through the Workspace Launcher wizard; to open this wizard, navigate to File > Switch Workspace > Other.
Workspace Launcher
Figure 1.1. Workspace Launcher

For information about configuring workspaces, refer to Reference > Preferences > Workspace in the Workbench User Guide (Help Contents).
A project can be imported directly into Eclipse if it contains the necessary Eclipse metafiles. Eclipse uses these files to determine what kind of perspectives, tools, and other user interface configurations to implement.
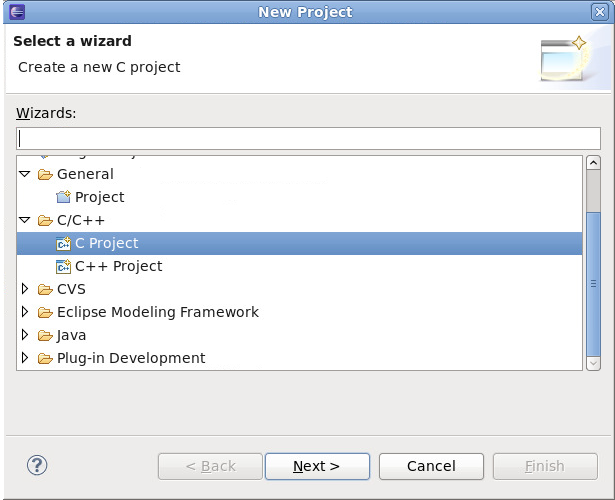
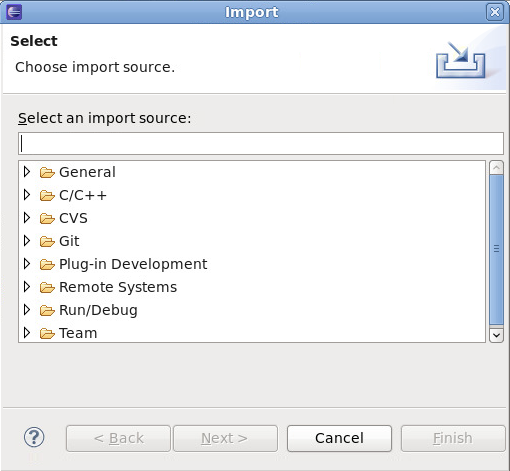
As such, when attempting to import a project that has never been used on Eclipse, it may be necessary to do so through the New Project wizard instead of the Import wizard. Doing so will create the necessary Eclipse metafiles for the project, which you can also include when you commit the project.
New Project Wizard
Figure 1.2. New Project Wizard

The Import wizard is suitable mostly for projects that were created or previously edited in Eclipse, i.e. projects that contain the necessary Eclipse metafiles.
Import Wizard
Figure 1.3. Import Wizard

1.2. Help In Eclipse

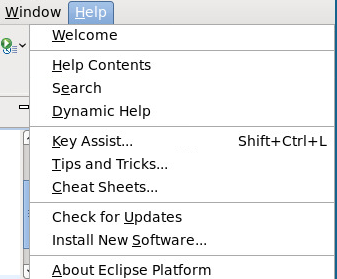
Eclipse features a comprehensive internal help library that covers nearly every facet of the Integrated Development Environment (IDE). Every Eclipse documentation plug-in installs its content to this library, where it is indexed accordingly. To access this library, use the Help menu.
Help
Figure 1.4. Help

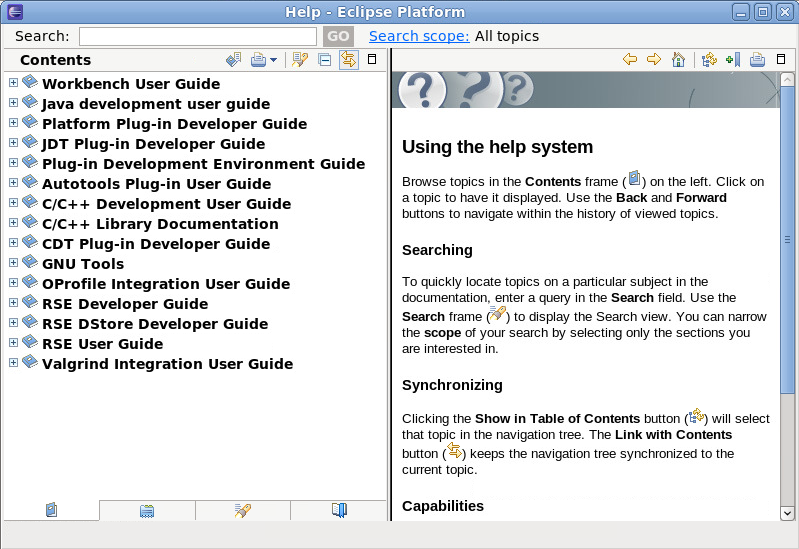
To open the main Help menu, navigate to Help > Help Contents. The Help menu displays all the available content provided by installed documentation plug-ins in the Contents field.
Help Menu
Figure 1.5. Help Menu

The tabs at the bottom of the Contents field provides different options for accessing Eclipse documentation. You can navigate through each "book" by section/header or by simply searching via the Search field. You can also bookmark sections in each book and access them through the Bookmarks tab.
The Workbench User Guide documents all facets of the Eclipse user interface extensively. It contains very low-level information on the Eclipse workbench, perspectives, and different concepts useful in understanding how Eclipse works. The Workbench User Guide is an ideal resource for users with little to intermediate experience with Eclipse or IDEs in general. This documentation plug-in is installed by default.
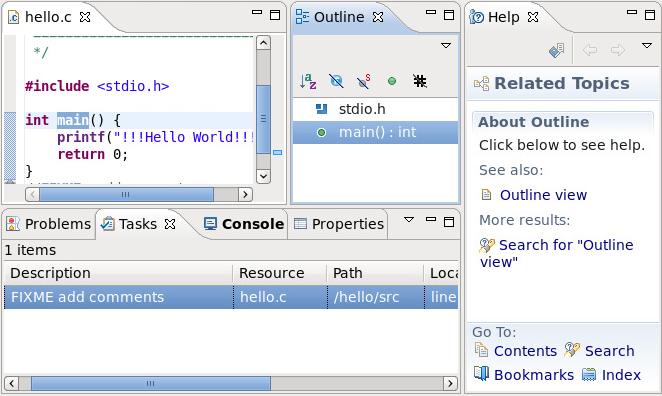
The Eclipse help system also includes a dynamic help feature. This feature opens a new window in the workbench that displays documentation relating to a selected interface element. To activate dynamic help, navigate to Help > Dynamic Help.
Dynamic Help
Figure 1.6. Dynamic Help

The rightmost window in Figure 1.6, “Dynamic Help” displays help topics related to the Outline view, which is the selected user interface element.

1.3.  Development Toolkits

Red Hat Enterprise Linux 6 supports the primary Eclipse development toolkits for C/C++ (CDT) and Java (JDT). These toolkits provide a set of integrated tools specific to their respective languages. Both toolkits supply Eclipse GUI interfaces with the required tools for editing, building, running, and debugging source code.
Each toolkit provides custom editors for their respective language. Both CDT and JDT also provide multiple editors for a variety of file types used in a project. For example, the CDT supplies different editors specific for C/C++ header files and source files, along with a Makefile editor.
Toolkit-supplied editors provide error parsing for some file types (without requiring a build), although this may not be available on projects where cross-file dependencies exist. The CDT source file editor, for example, provides error parsing in the context of a single file, but some errors may only be visible when a complete project is built. Other common features among toolkit-supplied editors are colorization, code folding, and automatic indentation. In some cases, other plug-ins provide advanced editor features such as automatic code completion, hover help, and contextual search; a good example of such a plug-in is libhover, which adds these extended features to C/C++ editors (refer to Section 2.2.2, “libhover Plug-in” for more information).
User interfaces for most (if not all) steps in creating a project's target (inary, file, library, etc) are provided by the build functionalities of each toolkit. Each toolkit also provides Eclipse with the means to automate as much of the build process as possible, helping you concentrate more on writing code than building it. Both toolkits also add useful UI elements for finding problems in code preventing a build; for example, Eclipse sends compile errors to the Problems view. For most error types, Eclipse allows you to navigate directly to an error's cause (file and code segment) by simply clicking on its entry in the Problems view.
As is with editors, other plug-ins can also provide extended capabilities for building a project — the Autotools plug-in, for example, allows you to add portability to a C/C++ project, allowing other developers to build the project in a wide variety of environments (for more information, refer to Section 4.3, “Autotools”).
For projects with executable/binary targets, each toolkit also supplies run/debug functionalities to Eclipse. In most projects, "run" is simply executed as a "debug" action without interruptions. Both toolkits tie the Debug view to the Eclipse editor, allowing breakpoints to be set. Conversely, triggered breakpoints open their corresponding functions in code in the editor. Variable values can also be explored by clicking their names in the code.
For some projects, build integration is also possible. With this, Eclipse automatically rebuilds a project or installs a "hot patch" if you edit code in the middle of a debugging session. This allows a more streamlined debug-and-correct process, which some developers prefer.
The Eclipse Help menu provides extensive documentation on both CDT and JDT. For more information on either toolkit, refer to the Java Development User Guide or C/C++ Development User Guide in the Eclipse Help Contents.

Chapter 2. The Eclipse Integrated Development Environment (IDE)

2.1. User Interface
2.2. Useful Hints
2.2.1. The quick access menu
2.2.2. libhover Plug-in
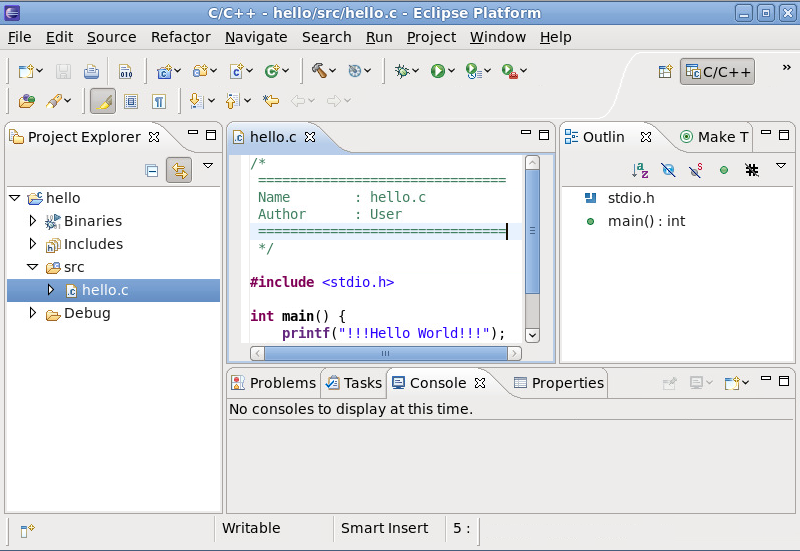
The entire user interface in Figure 2.1, “Eclipse User Interface (default)” is referred to as the Eclipse workbench. It is generally composed of a code Editor, Project Explorer window, and several views. All elements in the Eclipse workbench are configurable, and fully documented in the Workbench User Guide (Help Contents). Refer to Section 2.2, “Useful Hints” for a brief overview on customizing the user interface.
Eclipse features different perspectives. A perspective is a set of views and editors most useful to a specific type of task or project; the Eclipse workbench can contain one or more perspectives. Figure 2.1, “Eclipse User Interface (default)” features the default perspective for C/C++.
Eclipse also divides many functions into several classes, housed inside distinct menu items. For example, the Project menu houses functions relating to compiling/building a project. The Window menu contains options for creating and customizing perspectives, menu items, and other user interface elements. For a brief overview of each main menu item, refer to Reference > C/C++ Menubar in the C/C++ Development User Guide or Reference > Menus and Actions in the Java Development User Guide.
The following sections provide a high-level overview of the different elements visible in the default user interface of the Eclipse integrated development environment (IDE).

2.1. User Interface

The Eclipse workbench provides a user interface for many features and tools essential for every phase of the development process. This section provides an overview of Eclipse's primary user interface.
Eclipse User Interface (default)
Figure 2.1. Eclipse User Interface (default)

Figure 2.1, “Eclipse User Interface (default)” displays the default workbench for C/C++ projects. To switch between available perspectives in a workbench, press Ctrl+F8. For some hints on perspective customization, refer to Section 2.2, “Useful Hints”. The figures that follow describe each basic element visible in the default C/C++ perspective.
Eclipse Editor
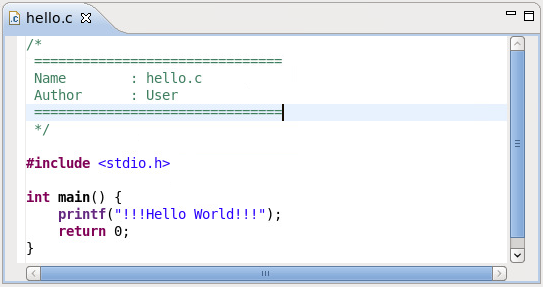
Figure 2.2. Eclipse Editor

The Editor is used to write and edit source files. Eclipse can autodetect and load an appropriate language editor (e.g. C Editor for files ending in .c) for most types of source files. To configure the settings for the Editor, navigate to Window > Preferences > language (e.g. Java, C++) > Code Style.
Project Explorer
Figure 2.3. Project Explorer

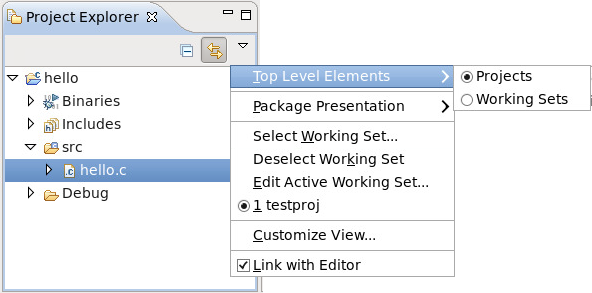
The Project Explorer View provides a hierarchial view of all project resources (binaries, source files, etc.). You can open, delete, or otherwise edit any files from this view.
The View Menu button in the Project Explorer View allows you to configure whether projects or working sets are the top-level items in the Project Explorer View. A working set is a group of projects arbitrarily classified as a single set; working sets are handy in organizing related or linked projects.
Outline Window
Figure 2.4. Outline Window

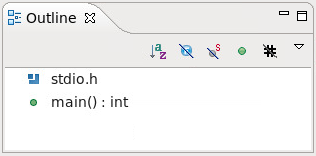
The Outline window provides a condensed view of the code in a source file. It details different variables, functions, libraries, and other structural elements from the selected file in the Editor, all of which are editor-specific.
Console View
Figure 2.5. Console View

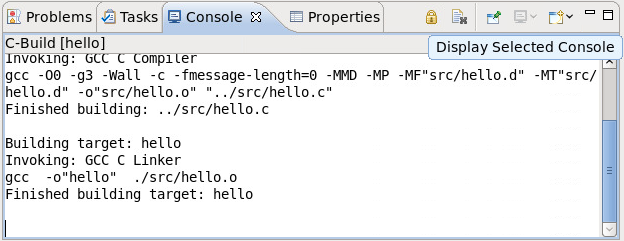
Some functions and plugged-in programs in Eclipse send their output to the Console view. This view's Display Selected Console button allows you to switch between different consoles.
Tasks View
Figure 2.6. Tasks View

The Tasks view allows you to track specially-marked reminder comments in the code. This view shows the location of each task comment and allows you to sort them in several ways.
Sample of Tracked Comment
Figure 2.7. Sample of Tracked Comment

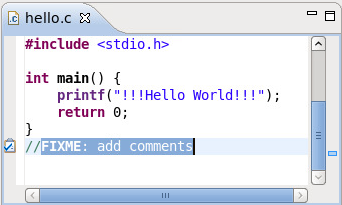
Most Eclipse editors track comments marked with //FIXME or //TODO tags. Tracked comments—i.e. task tags—are different for source files written in other languages. To add or configure task tags, navigate to Window > Preferences and use the keyword task tags to display the task tag configuration menus for specific editors/languages.
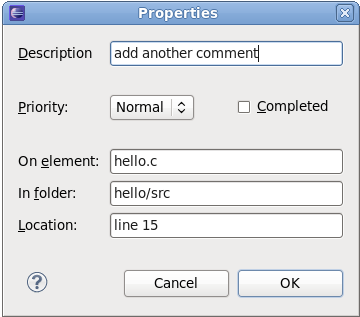
Task Properties
Figure 2.8. Task Properties

Alternatively, you can also use Edit > Add Task to open the task Properties menu (Figure 2.8, “Task Properties”). This will allow you to add a task to a specific location in a source file without using a task tag.
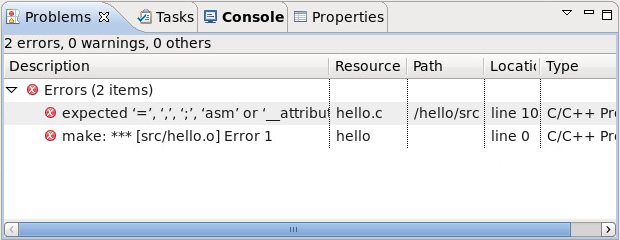
Problems View
Figure 2.9. Problems View

The Problems view displays any errors or warnings that occurred during the execution of specific actions such as builds, cleans, or profile runs. To display a suggested "quick fix" to a specific problem, select it and press Ctrl+1.

2.2. Useful Hints

Many Eclipse users learn useful tricks and troubleshooting techniques throughout their experience with the Eclipse user interface. This section highlights some of the more useful hints that users new to Eclipse may be interested in learning. The Tips and Tricks section of the Workbench User Guide contains a more extensive list of Eclipse tips.

2.2.1. The quick access menu

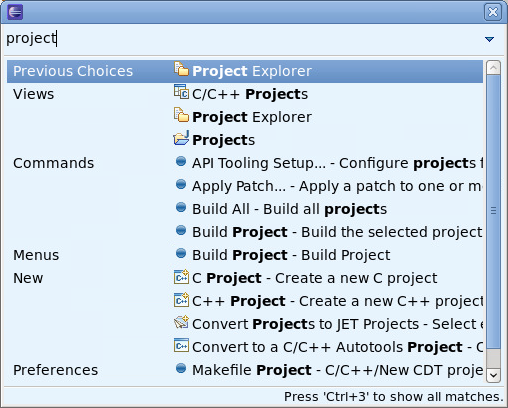
One of the most useful Eclipse tips is to use the quick access menu. Typing a word in the quick access menu will present a list of Views, Commands, Help files and other actions related to that word. To open this menu, press Ctrl+3.
Quick Access Menu
Figure 2.10. Quick Access Menu

In Figure 2.10, “Quick Access Menu”, clicking Views > Project Explorer will select the Project Explorer window. Clicking any item from the Commands, Menus, New, or Preferences categories to run the selected item. This is similar to navigating to or clicking the respective menu options or taskbar icons. You can also navigate through the quick access menu using the arrow keys.
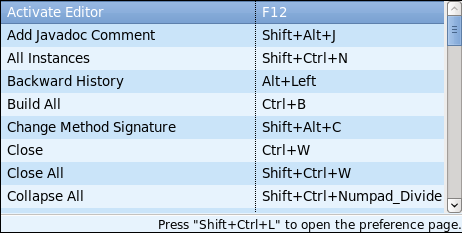
It is also possible to view a complete list of all keyboard shortcut commands; to do so, press Shift+Ctrl+L.
Keyboard Shortcuts
Figure 2.11. Keyboard Shortcuts

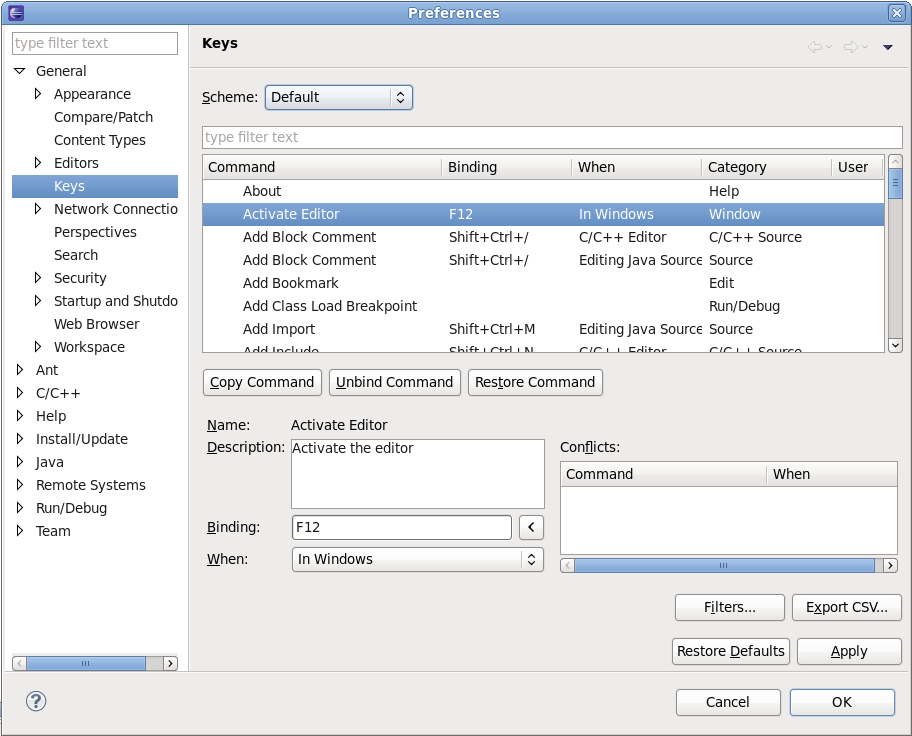
To configure Eclipse keyboard shortcuts, press Shift+Ctrl+L again while the Keyboard Shortcuts list is open.
Configuring Keyboard Shortcuts
Figure 2.12. Configuring Keyboard Shortcuts

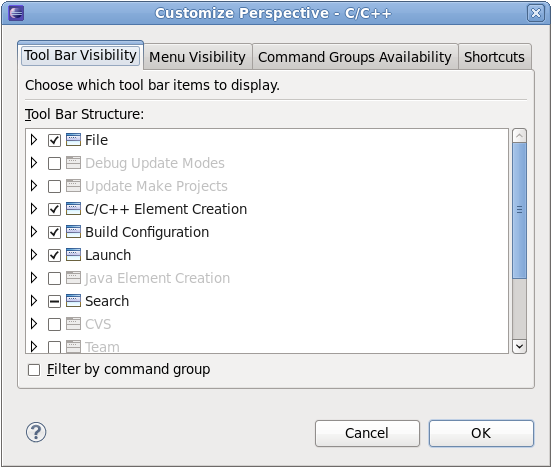
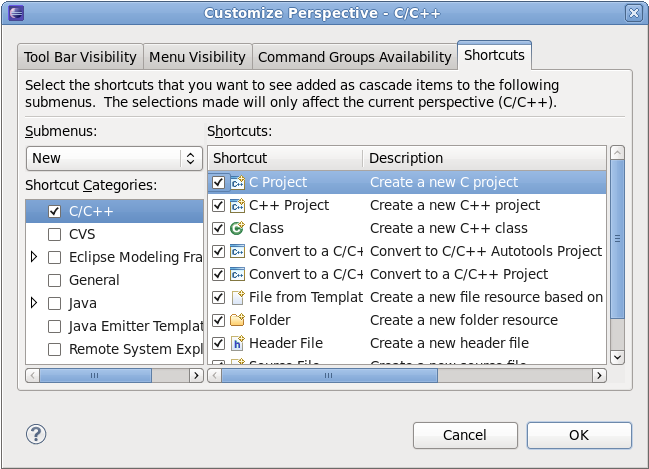
To customize the current perspective, navigate to Window > Customize Perspective. This will opens the Customize Perspective menu, allowing the visible tool bars, main menu itmes, command groups, and short cuts to be configured.
The location of each view within the workbench can be customized by clicking on a view's title and dragging it to a desired location.
Customize Perspective Menu
Figure 2.13. Customize Perspective Menu

Figure 2.13, “Customize Perspective Menu” displays the Tool Bar Visibility tab. As the name suggests, this tab allows you to toggle the visibility of the tool bars (Figure 2.14, “Toolbar”).
Toolbar
Figure 2.14. Toolbar

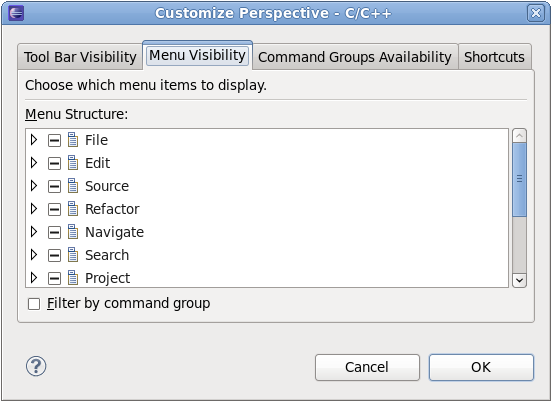
The following figures display the other tabs in the Customize Perspective Menu:
Menu Visibility Tab
Figure 2.15. Menu Visibility Tab

The Menu Visibility tab configures what functions are visible in each main menu item. For a brief overview of each main menu item, refer to Reference > C/C++ Menubar in the C/C++ Development User Guide or Reference > Menus and Actions in the Java Development User Guide.
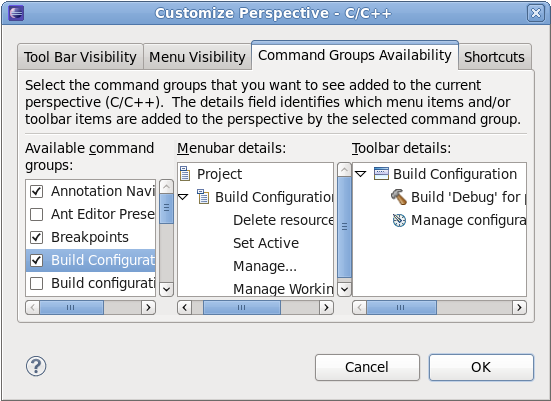
Command Group Availability Tab
Figure 2.16. Command Group Availability Tab

Command groups add functions or options to the main menu or tool bar area. Use the Command Group Availability tab to add or remove a Command group. The Menubar details and Toolbar details fields display the functions or options added by the Command group to either Main Menu or Toolbar Area, respectively.
Shortcuts Tab
Figure 2.17. Shortcuts Tab

The Shortcuts tab configures what menu items are available under the following submenus:
  • File > New
  • Window > Open Perspective
  • Window > Show View

2.2.2. libhover Plug-in

The libhover plug-in for Eclipse provides plug-and-play hover help support for the GNU C Library and GNU C++ Standard Library. This allows developers to refer to existing documentation on glibc and libstdc++ libraries within the Eclipse IDE in a more seamless and convenient manner via hover help and code completion.
For C++ library resources, libhover needs to index the file using the CDT indexer. Indexing parses the given file in context of a build; the build context determines where header files come from and how types, macros, and similar items are resolved. To be able to index a C++ source file, libhover usually requires you to perform an actual build first, although in some cases it may already know where the header files are located.
The libhover plug-in may need indexing for C++ sources because a C++ member function name is not enough information to look up its documentation. For C++, the class name and parameter signature of the function is also required to determine exactly which member is being referenced. This is because C++ allows different classes to have members of the same name, and even within a class, members may have the same name but with different method signatures.
In addition, C++ also has type definitions and templated classes to deal with. Such information requires parsing an entire file and its associated include files; libhover can only do this via indexing.
C functions, on the other hand, can be referenced in their documentation by name alone. As such, libhover does not need to index C source files in order to provide hover help or code completion. Simply choose an appropriate C header file to be included for a selection.

2.2.2.1.  Setup and Usage

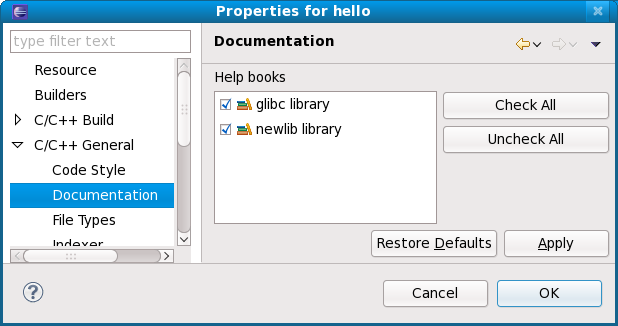
Hover help for all installed libhover libraries is enabled by default, and it can be disabled per project. To disable or enable hover help for a particular project, right-click the project name and click Properties. On the menu that appears, navigate to C/C++ General > Documentation. Check or uncheck a library in the Help books section to enable or disable hover help for that particular library.
Enabling/Disabling Hover Help
Figure 2.18. Enabling/Disabling Hover Help

Disabling hover help from a particular library may be preferable, particularly if multiple libhover libraries overlap in functionality. For example, the newlib library (whose libhover library plug-in is supported in Red Hat Enterprise Linux 6) contains functions whose names overlap with those in the GNU C library (provided by default); having libhover plugins for both newlib and glibc installed would mean having to disable one.
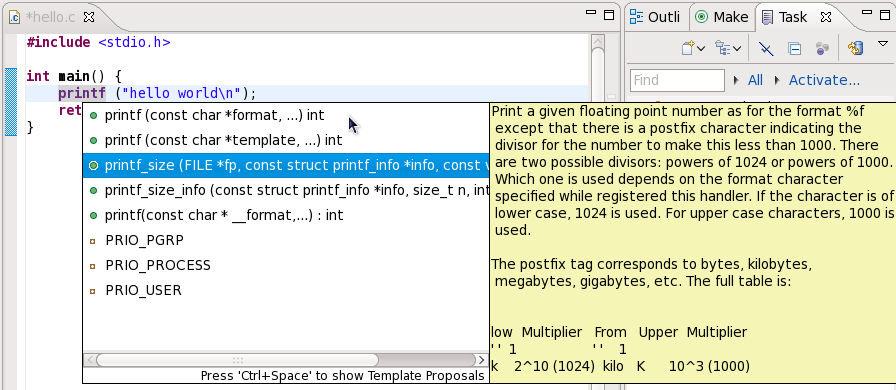
When multiple libhover libraries libraries are enabled and there exists a functional overlap between libraries, the Help content for the function from the first listed library in the Help books section will appear in hover help (i.e. in Figure 2.18, “Enabling/Disabling Hover Help”, glibc). For code completion, libhover will offer all possible alternatives from all enabled libhover libraries.
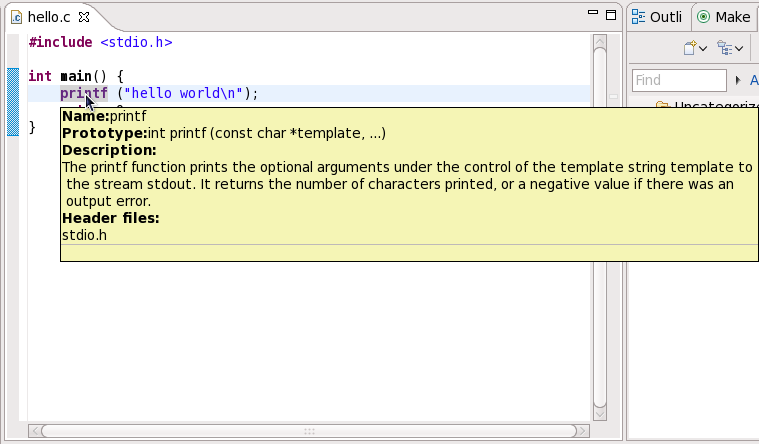
To use hover help, simply hover the mouse over a function name or member function name in the C/C++ Editor. After a few seconds, libhover will display library documentation on the selected C function or C++ member function.
Using Hover Help
Figure 2.19. Using Hover Help

To use code completion, select a string in the code and press Ctrl+Space. This will display all possible functions given the selected string; click on a possible function to view its description.
Using Code Completion
Figure 2.20. Using Code Completion

Chapter 3. Libraries and Runtime Support

3.1. Version Information
3.2. Compatibility
3.2.1. API Compatibility
3.2.2. ABI Compatibility
3.2.3. Policy
3.2.4. Static Linking
3.3. Library and Runtime Details
3.3.1. The GNU C Library
3.3.2. The GNU C++ Standard Library
3.3.3. Boost
3.3.4. Qt
3.3.5. KDE Development Framework
3.3.6. Python
3.3.7. Java
3.3.8. Ruby
3.3.9. Perl
Red Hat Enterprise Linux 6 supports the development of custom applications in a wide variety of programming languages using proven, industrial-strength tools. This chapter describes the runtime support libraries provided in Red Hat Enterprise Linux 6.

3.1. Version Information

The following table compares the version information for runtime support packages in supported programming languages between Red Hat Enterprise Linux 6 and Red Hat Enterprise Linux 5.
This is not an exhaustive list. Instead, this is a survey of standard language runtimes, and key dependencies for software developed on Red Hat Enterprise Linux 6.
Table 3.1. Language and Runtime Library Versions
Package Name 6 5 4
glibc 2.12 2.5 2.3
libstdc++ 4.4 4.1 3.4
boost 1.41 1.33 1.32
java 1.5 (IBM), 1.6 (IBM, OpenJDK) 1.4, 1.5, and 1.6 1.4
python 2.6 2.4 2.3
php 5.3 5.1 4.3
ruby 1.8 1.8 1.8
httpd 2.2 2.2 2.0
postgresql 8.4 8.1 7.4
mysql 5.1 5.0 4.1
nss 3.12 3.12 3.12
openssl 1.0.0 0.9.8e 0.9.7a
libX11 1.3 1.0
firefox 3.6 3.6 3.6
kdebase 4.3 3.5 3.3
gtk2 2.18 2.10 2.04

3.2. Compatibility

Compatibility specifies the portability of binary objects and source code across different instances of a computer operating environment. There are two types of compatibility:
Source Compatibility
Source compatibility specifies that code will compile and execute in a consistent and predictable way across different instances of the operating environment. This type of compatibility is defined by conformance with specified Application Programming Interfaces (APIs).
Binary Compatibility
Binary Compatibility specifies that compiled binaries in the form of executables and Dynamic Shared Objects (DSOs) will run correctly across different instances of the operating environment. This type of compatibility is defined by conformance with specified Application Binary Interfaces (ABIs).

3.2.1. API Compatibility

Source compatibility enables a body of application source code to be compiled and operate correctly on multiple instances of an operating environment, across one or more hardware architectures, as long as the source code is compiled individually for each specific hardware architecture.
Source compatibility is defined by an Application Programming Interface (API), which is a set of programming interfaces and data structures provided to application developers. The programming syntax of APIs in the C programming language are defined in header files. These header files specify data types and programmatic functions. They are available to programmers for use in their applications, and are implemented by the operating system or libraries. The syntax of APIs are enforced at compile time, or when the application source code is compiled to produce executable binary objectcode.
APIs are classified as:
  • De facto standards ­ not formally specified but implied by a particular implementation.
  • De jure standards ­ formally specified in standards documentation.
In all cases, application developers should seek to ensure that any behavior they depend on is described in formal API documentation, so as to avoid introducing dependencies on unspecified implementation specific semantics or even introducing dependencies on bugs in a particular implementation of an API. For example, new releases of the GNU C library are not guaranteed to be compatible with older releases if the old behavior violated a specification.
Red Hat Enterprise Linux by and large seeks to implement source compatibility with a variety of de jure industry standards developed for Unix operating environments. While Red Hat Enterprise Linux does not fully conform to all aspects of these standards, the standards documents do provide a defined set of interfaces, and many components of Red Hat Enterprise Linux track compliance with them (particularly glibc, the GNU C Library, and gcc, the GNU C/C++/Java/Fortran Compiler). There are and will be certain aspects of the standards which are not implemented as required on Linux.

3.2.2. ABI Compatibility

Binary compatibility enables a single compiled binary to operate correctly on multiple instances of an operating environment that share a common hardware architecture (whether that architecture support is implemented in native hardware or a virtualization layer), but a different underlying software architecture.
Binary compatibility is defined by an Application Binary Interface (ABI). The ABI is a set of runtime conventions adhered to by all tools which deal with a compiled binary representation of a program. Examples of such tools include compilers, linkers, runtime libraries, and the operating system itself. The ABI includes not only the binary file formats, but also the semantics of library functions which are used by applications.

3.2.3. Policy

Ideally you should rebuild and repackage your applications for each major release. This will allow you take advantage of new optimizations in the compiler, as well as new features available in the latest tools.
However, we understand there are times when it is useful to build one set of binaries that can be deployed on multiple major releases at once. This is especially useful with old code bases that are not compliant to the latest revision of the language standards available in more recent Red Hat Enterprise Linux releases.
As such, Red Hat advises that you refer to the Red Hat Enterprise Linux 6 Application Compatibility Specification for guidance. This document outlines Red Hat policy and recommendations regarding backwards compatibility, particularly for specific packages.

3.2.4. Static Linking

Static linking is emphatically discouraged for all Red Hat Enterprise Linux releases. Static linking causes far more problems than it solves, and should be avoided at all costs.
The main drawback of static linking is that it is only guaranteed to work on the system it was built, and even so, only until the next release of glibc or libstdc++ (in the case of C++). There is no forward or backward compatibility with a static build. Furthermore, any security fixes (or general-purpose fixes) in subsequent updates to the libraries will not be avilable unless the affected statically linked executables are re-linked.
Additional reasons to avoid static linking include:
  • Larger memory footprint.
  • Slower application startup time.
  • Reduced glibc features with static linking.
  • Security measures like load address randomization cannot be used.
  • Dynamic loading of shared objects outside of glibc is not supported.
The above are only a handful of reasons why static linking should be avoided. For additional reasons, see: Static Linking Considered Harmful.

3.3. Library and Runtime Details

3.3.1. The GNU C Library

The glibc package contains the GNU C Library. This defines all functions specified by the ISO C standard, POSIX specific features, some Unix derivatives, and GNU-specific extensions. The most important set of shared libraries in the GNU C Library are the standard C and math libraries.
The GNU C Library defines its functions through specific header files, which you can declare in source code. Each header file contains definitions of a group of related facilities; for example, the stdio.h header file defines I/O-specific facilities, while math.h defines functions for computing mathematical operations.

3.3.1.1. GNU C Library Updates

The Red Hat Enterprise Linux 6 version of the GNU C Library features the following improvements over its Red Hat Enterprise Linux 5 version:
  • Added locales, including:
    • bo_CN
    • bo_IN
    • shs_CA
    • ber_DZ
    • ber_MA
    • en_NG
    • fil_PH
    • fur_IT
    • fy_DE
    • ha_NG
    • ig_NG
    • ik_CA
    • iu_CA
    • li_BE
    • li_NL
    • nds_DE
    • nds_NL
    • pap_AN
    • sc_IT
    • tk_TM
  • Added new interfaces, namely:
    • preadv
    • preadv64
    • pwritev
    • pwritev64
    • malloc_info
    • mkostemp
    • mkostemp64
  • Added new Linux-specific interfaces, namely:
    • epoll_pwait
    • sched_getcpu
    • accept4
    • fallocate
    • fallocate64
    • inotify_init1
    • dup3
    • epoll_create1
    • pipe2
    • signalfd
    • eventfd
    • eventfd_read
    • eventfd_write
  • Added new checking functions, namely:
    • asprintf
    • dprintf
    • obstack_printf
    • vasprintf
    • vdprintf
    • obstack_vprintf
    • fread
    • fread_unlocked
    • open*
    • mq_open
For a more detailed list of updates to the GNU C Library, refer to /usr/share/doc/glibc-version/NEWS . All changes as of version 2.6 apply to the GNU C Library in Red Hat Enterprise Linux 6. Some of these changes have also been backported to Red Hat Enterprise Linux 5 versions of glibc.

3.3.1.2. GNU C Library Documentation

The GNU C Library is fully documented in the GNU C Library manual; to access this manual locally, install glibc-devel and run info libc. An upstream version of this book is also available here:

3.3.2. The GNU C++ Standard Library

The libstdc++ package contains the GNU C++ Standard Library, which is an ongoing project to implement the ISO 14882 Standard C++ library.
Installing the libstdc++ package will provide just enough to satisfy link dependencies (i.e. only shared library files). To make full use of all available libraries and header files for C++ development, you must install libstdc++-devel as well. The libstdc++-devel package also contains a GNU-specific implementation of the Standard Template Library (STL).
As the C++ language and runtime implementation has remained stable throughout Red Hat Enterprise Linuxes 4, 5, and 6, no compatibility libraries are needed for libstdc++. However, combatability libraries compat-libstdc++-296 for Red Hat Enterprise Linux 2.1 and compat-libstdc++-33 for Red Hat Enterprise Linux 3 are provided for support.

3.3.2.1.  GNU C++ Standard Library Updates

The Red Hat Enterprise Linux 6 version of the GNU C++ Standard Library features the following improvements over its Red Hat Enterprise Linux 5 version:
  • Added support for elements of ISO C++ TR1, namely:
    • <tr1/array>
    • <tr1/complex>
    • <tr1/memory>
    • <tr1/functional>
    • <tr1/random>
    • <tr1/regex>
    • <tr1/tuple>
    • <tr1/type_traits>
    • <tr1/unordered_map>
    • <tr1/unordered_set>
    • <tr1/utility>
    • <tr1/cmath>
  • Added support for elements of the upcoming ISO C++ standard, C++0x. These elements include:
    • <array>
    • <chrono>
    • <condition_variable>
    • <forward_list>
    • <functional>
    • <initalizer_list>
    • <mutex>
    • <random,
    • <ratio>
    • <regex>
    • <system_error>
    • <thread>
    • <tuple>
    • <type_traits
    • <unordered_map>
    • <unordered_set>
  • Added support for the -fvisibility command.
  • Added the following extensions:
    • __gnu_cxx::typelist
    • __gnu_cxx::throw_allocator
For more information about updates to libstdc++ in Red Hat Enterprise Linux 6, refer to the C++ Runtime Library section of the following documents:

3.3.2.2.  GNU C++ Standard Library Documentation

To use the man pages for library components, install the libstdc++-docs package. This will provide man page information for nearly all resources provided by the library; for example, to view information about the vector container, use its fully-qualified component name:
man std::vector
This will display the following information (abbreviated):
std::vector(3)                                                  std::vector(3)

NAME
       std::vector -

       A standard container which offers fixed time access to individual
       elements in any order.

SYNOPSIS
       Inherits std::_Vector_base< _Tp, _Alloc >.

   Public Types
       typedef _Alloc allocator_type
       typedef __gnu_cxx::__normal_iterator< const_pointer, vector >
           const_iterator
       typedef _Tp_alloc_type::const_pointer const_pointer
       typedef _Tp_alloc_type::const_reference const_reference
       typedef std::reverse_iterator< const_iterator >
The libstdc++-docs package also provides manuals and reference information in HTML form at the following directory:
file:///usr/share/doc/libstdc++-docs-version/html/spine.html
The main site for the development of libstdc++ is hosted on gcc.gnu.org.

3.3.3. Boost

The boost package contains a large number of free peer-reviewed portable C++ source libraries. These libraries are suitable for tasks such as portable file-systems and time/date abstraction, serialization, unit testing, thread creation and multi-process synchronization, parsing, graphing, regular expression manipulation, and many others.
Installing the boost package will provide just enough to satisfy link dependencies (i.e. only shared library files). To make full use of all available libraries and header files for C++ development, you must install boost-devel as well.
The boost package is actually a meta-package, containing many library sub-packages. These sub-packages can also be installed in an a la carte fashion to provide finer inter-package dependency tracking. The meta-package inclues all of the following sub-packages:
  • boost-date-time
  • boost-filesystem
  • boost-graph
  • boost-iostreams
  • boost-math
  • boost-program-options
  • boost-python
  • boost-regex
  • boost-serialization
  • boost-signals
  • boost-system
  • boost-test
  • boost-thread
  • boost-wave
Not included in the meta-package are packages for static linking or packages that depend on the underlying Message Passing Interface (MPI) support.
MPI support is provided in two forms: one for the default Open MPI implementation [1] , and another for the alternate MPICH2 implementation. The selection of the underlying MPI library in use is up to the user and depends on specific hardware details and user preferences. For more details, please consult https://fedoraproject.org/wiki/Packaging:MPI for information on MPI Packaging conventions. Please note that these packages can be installed in parallel, as installed files have unique directory locations.
For Open MPI:
  • boost-openmpi
  • boost-openmpi-devel
  • boost-graph-openmpi
  • boost-openmpi-python
For MPICH2:
  • boost-mpich2
  • boost-mpich2-devel
  • boost-graph-mpich2
  • boost-mpich2-python
If static linkage cannot be avoided, the boost-static package will install the necessary static libraries. Both thread-enabled and single-threaded libraries are provided.

3.3.3.1. Boost Updates

The Red Hat Enterprise Linux 6 version of Boost features many packaging improvements and new features.
Several aspects of the boost package have changed. As noted above, the monolithic boost package has been augmented by smaller, more discrete sub-packages. This allows for more control of dependencies by users, and for smaller binary packages when packaging a custom application that uses Boost.
In addition, both single-threaded and multi-threaded versions of all libraries are packaged. The multi-threaded versions include the mt suffix, as per the usual Boost convention.
Boost also features the following new libraries:
  • Foreach
  • Statechart
  • TR1
  • Typeof
  • Xpressive
  • Asio
  • Bitmap
  • Circular Buffer
  • Function Types
  • Fusion
  • GIL
  • Interprocess
  • Intrusive
  • Math/Special Functions
  • Math/Statistical Distributions
  • MPI
  • System
  • Accumulators
  • Exception
  • Units
  • Unordered
  • Proto
  • Flyweight
  • Scope Exit
  • Swap
  • Signals2
  • Property Tree
Many of the existing libraries have been improved, bug-fixed, and otherwise enhanced.

3.3.3.2. Boost Documentation

The boost-doc package provides manuals and reference information in HTML form located in the following directory:
file:///usr/share/doc/boost-doc-version/index.html
The main site for the development of Boost is hosted on boost.org.

3.3.4. Qt

The qt package provides the Qt (pronounced "cute") cross-platform application development framework used in the development of GUI programs. Aside from being a popular "widget toolkit", Qt is also used for developing non-GUI programs such as console tools and servers. Qt was used in the development of notable projects such as Google Earth, KDE, Opera, OPIE, VoxOx, Skype, VLC media player and VirtualBox. It is produced by Nokia's Qt Development Frameworks division, which came into being after Nokia's acquisition of the Norwegian company Trolltech, the original producer of Qt, on June 17, 2008.
Qt uses standard C++ but makes extensive use of a special pre-processor called the Meta Object Compiler (MOC) to enrich the language. Qt can also be used in other programming languages via language bindings. It runs on all major platforms and has extensive internationalization support. Non-GUI Qt features include SQL database access, XML parsing, thread management, network support, and a unified cross-platform API for file handling.
Distributed under the terms of the GNU Lesser General Public License (among others), Qt is free and open source software. The Red Hat Enterprise Linux 6 version of Qt supports a wide range of compilers, including the GCC C++ compiler and the Visual Studio suite.

3.3.4.1. Qt Updates

Some of the improvements the Red Hat Enterprise Linux 6 version of Qt include:
  • Advanced user experience
    • Advanced Graphics Effects:options for opacity, drop-shadows, blur, colorization, and other similar effects
    • Animation and State Machine:create simple or complex animations without the hassle of managing complex code
    • Gesture and multi-touch support
  • Support for new platforms
    • Windows 7, Mac OSX 10.6, and other desktop platforms are now supported
    • Added support for mobile development; Qt is optimized for the upcoming Maemo 6 platform, and will soon be ported to Maemo 5. In addition, Qt now supports the Symbian platform, with integration for the S60 framework.
    • Added support for Real-Time Operating Systems such as QNX and VxWorks
  • Improved performance, featuring added support for hardware-accelerated rendering (along with other rendering updates)
  • Updated cross-platform IDE
For more details on updates to Qt included in Red Hat Enterprise Linux 6, refer to the following links:

3.3.4.2. Qt Creator

Qt Creator is a cross-platform IDE tailored to the needs of Qt developers. It includes the following graphical tools:
  • An advanced C++ code editor
  • Integrated GUI layout and forms designer
  • Project and build management tools
  • Integrated, context-sensitive help system
  • Visual debugger
  • Rapid code navigation tools
For more information about Qt Creator, refer to the following link:

3.3.4.3. Qt Library Documentation

The qt-doc package provides HTML manuals and references located in /usr/share/doc/qt4/html/. This package also provides the Qt Reference Documentation, which is an excellent starting point for development within the Qt framework.
You can also install further demos and examples from qt-demos and qt-examples. To get an overview of the capabilities of the Qt framework, refer to /usr/bin/qtdemo-qt4 (provided by qt-demos).
For more information on the development of Qt, refer to the following online resources:

3.3.5. KDE Development Framework

The kdelibs-devel package provides the KDE libraries, which build on Qt to provide a framework for making application development easier. The KDE development framework also helps provide consistency accross the KDE desktop environment.

3.3.5.1. KDE4 Architecture

The KDE development framework's architecture in Red Hat Enterprise Linux 6 uses KDE4, which is built on the following technologies:
Plasma
Plasma replaces KDesktop in KDE4. Its implementation is based on the Qt Graphics View Framework, which was introduced in Qt 4.2. For more information about Plasma, refer to http://techbase.kde.org/Development/Architecture/KDE4/Plasma.
Sonnet
Sonnet is a multilingual spell-checking application that supports automatic language detection, primary/backup dictionaries, and other useful features. It replaces kspell2 in KDE4.
KIO
The KIO library provides a framework for network-transparent file handling, allowing users to easily access files through network-transparent protocols. It also helps provides standard file dialogs.
KJS/KHTML
KJS and KHTML are fully-fledged JavaScript and HTML engines used by different applications native to KDE4 (such as konqueror).
Solid
Solid is a hardware and network awareness framework that allows you to develop applications with hardware interaction features. Its comprehensive API provides the necessary abstraction to support cross-platform application development. For more information, refer to http://techbase.kde.org/Development/Architecture/KDE4/Solid.
Phonon
Phonon is a multimedia framework that helps you develop applications with multimedia functionalities. It facilitates the usage of media capabilities within KDE. For more information, refer to http://techbase.kde.org/Development/Architecture/KDE4/Phonon.
Telepathy
Telepathy provides a real-time communication and collaboration framework within KDE4. Its primary function is to tighten integration between different components within KDE. For a brief overview on the project, refer to http://community.kde.org/Real-Time_Communication_and_Collaboration.
Akonadi
Akonadi provides a framework for centralizing storage of Parallel Infrastructure Management (PIM) components. For more information, refer to http://techbase.kde.org/Development/Architecture/KDE4/Akonadi.
Online Help within KDE4
KDE4 also features an easy-to-use Qt-based framework for adding online help capabilities to applications. Such capabilities include tooltips, hover-help information, and khelpcenter manuals. For a brief overview on online help within KDE4, refer to http://techbase.kde.org/Development/Architecture/KDE4/Providing_Online_Help.
KXMLGUI
KXMLGUI is a framework for designing user interfaces using XML. This framework allows you to design UI elements based on "actions" (defined by the developer) without having to revise source code. For more information, refer to http://developer.kde.org/documentation/library/kdeqt/kde3arch/xmlgui.html.
Strigi
Strigi is a desktop search daemon compatible with many desktop environments and operating systems. It uses its own jstream system which allows for deep indexing of files. For more information on the development of Strigi, refer to http://www.vandenoever.info/software/strigi/.
KNewStuff2
KNewStuff2 is a collaborative data sharing library used by many KDE4 applications. For more information, refer to http://techbase.kde.org/Projects/KNS2.

3.3.5.2. kdelibs Documentation

The kdelibs-apidocs package provides HTML documentation for the KDE development framework in /usr/share/doc/HTML/en/kdelibs4-apidocs/. The following links also provide details on KDE-related programming tasks:

3.3.6. Python

The python package adds support for the Python programming language. This package provides the object and cached bytecode files needed to enable runtime support for basic Python programs. It also contains the python interpreter and the pydoc documentation tool. The python-devel package contains the libraries and header files needed for developing Python extensions.
Red Hat Enterprise Linux also ships with numerous python-related packages. By convention, the names of these packages have a python prefix or suffix. Such packages are either library extensions or python bindings to an existing library. For instance, dbus-python is a Python language binding for D-Bus.
Note that both cached bytecode (*.pyc/*.pyo files) and compiled extension modules (*.so files) are incompatible between Python 2.4 (used in Red Hat Enterprise Linux 5) and Python 2.6 (used in Red Hat Enterprise Linux 6). As such, you will need to rebuild any extension modules you use that are not part of Red Hat Enterprise Linux.

3.3.6.1. Python Updates

The Red Hat Enterprise Linux 6 version of Python features various language changes. For information about these changes, refer to the following project resources:
Both resources also contain advice on porting code developed using previous Python versions.

3.3.6.2. Python Documentation

For more information about Python, refer to man python. You can also install python-docs, which provides HTML manuals and references in the following location:
file:///usr/share/doc/python-docs-version/html/index.html
For details on library and language components, use pydoc component_name. For example, pydoc math will display the following information about the math Python module:
Help on module math:

NAME
	math

FILE
	/usr/lib64/python2.6/lib-dynload/mathmodule.so

DESCRIPTION
	This module is always available.  It provides access to the
	mathematical functions defined by the C standard.

FUNCTIONS
	acos[...]
		acos(x)
		
		Return the arc cosine (measured in radians) of x.

	acosh[...]
		acosh(x)
		
		Return the hyperbolic arc cosine (measured in radians) of x.

	asin(...)
		asin(x)
		
		Return the arc sine (measured in radians) of x.

	asinh[...]
		asinh(x)
		
		Return the hyperbolic arc sine (measured in radians) of x.
The main site for the Python development project is hosted on python.org.

3.3.7. Java

The java-1.6.0-openjdk package adds support for the Java programming language. This package provides the java interpreter. The java-1.6.0-openjdk-devel package contains the javac compiler, as well as the libraries and header files needed for developing Java extensions.
Red Hat Enterprise Linux also ships with numerous java-related packages. By convention, the names of these packages have a java prefix or suffix.

3.3.7.1.  Java Documentation

For more information about Java, refer to man java. Some associated utilities also have their own respective man pages.
You can also install other Java documentation packages for more details about specific Java utilities. By convention, such documentation packages have the javadoc suffix (e.g. dbus-java-javadoc).
The main site for the development of Java is hosted on http://www.java.com. The main site for the library runtime of Java is hosted on http://icedtea.classpath.org.

3.3.8. Ruby

The ruby package provides the Ruby interpreter and adds support for the Ruby programming language. The ruby-devel package contains the libraries and header files needed for developing Ruby extensions.
Red Hat Enterprise Linux also ships with numerous ruby-related packages. By convention, the names of these packages have a ruby or rubygem prefix or suffix. Such packages are either library extensions or Ruby bindings to an existing library. For instance, ruby-dbus is a Ruby language binding for D-Bus.
Examples of ruby-related packages include:
  • ruby-flexmock
  • rubygem-flexmock
  • rubygems
  • ruby-irb
  • ruby-libguestfs
  • ruby-libs
  • ruby-qmf
  • ruby-qpid
  • ruby-rdoc
  • ruby-ri
  • ruby-saslwrapper
  • ruby-static
  • ruby-tcltk
For information about updates to the Ruby language in Red Hat Enterprise Linux 6, refer to the following resources:
  • file:///usr/share/doc/ruby-version/NEWS
  • file:///usr/share/doc/ruby-version/NEWS-version

3.3.8.1. gem2rpm

When packaging architecture-dependent gems, the gem2rpm tool may not work as expected on a Red Hat Enterprise Linux 6 default ruby environment. For information on how to work around this, refer to http://fedoraproject.org/wiki/Packaging/Ruby#Ruby_Gems.

3.3.8.2. Ruby Documentation

For more information about Ruby, refer to man ruby. You can also install ruby-docs, which provides HTML manuals and references in the following location:
file:///usr/share/doc/ruby-docs-version/
The main site for the development of Ruby is hosted on http://www.ruby-lang.org. The http://www.ruby-doc.org site also contains Ruby documentation.

3.3.9. Perl

The perl package adds support for the Perl programming language. This package provides Perl core modules, the Perl Language Interpreter, and the PerlDoc tool.
Red Hat also provides various perl modules in package form; these packages are named with the perl-* prefix. These modules provide stand-alone applications, language extensions, Perl libraries, and external library bindings.

3.3.9.1. Perl Updates

Red Hat Enterprise Linux 6.0 ships with perl-5.10.1. If you are running an older system, rebuild or alter external modules and applications accordingly in order to ensure optimum performance.
For a full list of the differences between the Perl versions refer to the following documents:

3.3.9.2. Installation

Perl's capabilities can be extended by installing additional modules. These modules come in the following forms:
Official Red Hat RPM
The official module packages can be installed with yum or rpm from the Red Hat Enterprise Linux repositories. They are installed to /usr/share/perl5 and either /usr/lib/perl5 for 32bit architectures or /usr/lib64/perl5 for 64bit architectures.
Modules from CPAN
Use the cpan tool provided by the perl-CPAN package to install modules directly from the CPAN website. They are installed to /usr/local/share/perl5 and either /usr/local/lib/perl5 for 32bit architectures or /usr/local/lib64/perl5 for 64bit architectures.
Third party module package
Third party modules are installed to /usr/share/perl5/vendor_perl and either /usr/lib/perl5/vendor_perl for 32bit architectures or /usr/lib64/perl5/vendor_perl for 64bit architectures.
Custom module package / manually installed module
These should be placed in the same directories as third party modules. That is, /usr/share/perl5/vendor_perl and either /usr/lib/perl5/vendor_perl for 32bit architectures or /usr/lib64/perl5/vendor_perl for 64bit architectures.

Warning

If an official version of a module is already installed, installing its non-official version can create conflicts in the /usr/share/man directory.

3.3.9.3. Perl Documentation

The perldoc tool provides documentation on language and core modules. To learn more about a module, use perldoc module_name. For example, perldoc CGI will display the following information about the CGI core module:
NAME
	CGI - Handle Common Gateway Interface requests and responses

SYNOPSIS
	use CGI;

	my $q = CGI->new;

[...]

DESCRIPTION
	CGI.pm is a stable, complete and mature solution for processing and preparing HTTP requests and responses.  Major features including processing form submissions, file uploads, reading and writing cookies, query string generation and manipulation, and processing and preparing HTTP headers. Some HTML generation utilities are included as well.

[...]

PROGRAMMING STYLE
		There are two styles of programming with CGI.pm, an object-oriented style and a function-oriented style.  In the object-oriented style you create one or more CGI objects and then use object methods to create the various elements of the page.  Each CGI object starts out with the list of named parameters that were passed to your CGI script by the server.  

[...]
For details on Perl functions, use perldoc -f function_name. For example, perldoc -f split wil display the following indormation about the split function:
split /PATTERN/,EXPR,LIMIT
split /PATTERN/,EXPR
split /PATTERN/
split   Splits the string EXPR into a list of strings and returns that list.  By default, empty leading fields are preserved, and empty trailing ones are deleted.  (If all fields are empty, they are considered to be trailing.)

In scalar context, returns the number of fields found. In scalar and void context it splits into the @_ array.  Use of split in scalar and void context is deprecated, however, because it clobbers your subroutine arguments.

If EXPR is omitted, splits the $_ string.  If PATTERN is also omitted, splits on whitespace (after skipping any leading whitespace).  Anything matching PATTERN is taken to be a delimiter separating the fields.  (Note that the delimiter may be longer than one character.)

[...]
Current PerlDoc documentation can be found on perldoc.perl.org.
Core and external modules are documented on the Comprehensive Perl Archive Network.


[1] MPI support is not available on IBM System Z machines (where Open MPI is not available).

Chapter 4.  Compiling and Building

4.1. GNU Compiler Collection (GCC)
4.1.1. GCC Status and Features
4.1.2. Language Compatibility
4.1.3. Object Compatibility and Interoperability
4.1.4. Backwards Compatibility Packages
4.1.5. Previewing RHEL6 compiler features on RHEL5
4.1.6. Running GCC
4.1.7. GCC Documentation
4.2. Distributed Compiling
4.3. Autotools
4.3.1. Autotools Plug-in for Eclipse
4.3.2. Configuration Script
4.3.3. Autotools Documentation
4.4. Eclipse Built-in Specfile Editor
Red Hat Enterprise Linux 6 includes many packages used for software development, inluding tools for compiling and building source code. This chapter discusses several of these packages and tools used to compile source code.

4.1. GNU Compiler Collection (GCC)

The GNU Compiler Collection (GCC) is a set of tools for compiling a variety of programming languages (including C, C++, ObjectiveC,ObjectiveC++, Fortran, and Ada) into highly optimized machine code. These tools include various compilers (like gcc and g++), run-time libraries (like libgcc, libstdc++, libgfortran, and libgomp), and miscellaneous other utilities.

4.1.1. GCC Status and Features

GCC for Red Hat Enterprise Linux 6 is based on the 4.4.x release series and includes several bug fixes, enhancements, and backports from upcoming releases (including the GCC 4.5). However, GCC 4.5 was not considered sufficiently mature for an enterprise distribution when RHEL6 features were frozen.
This standardization means that as updates to the 4.4 series become available (4.4.1, 4.4.2, ect), they will be incorporated into the compiler included with RHEL6 as updates. Red Hat may import additional backports and enhancements from upcoming releases outside the 4.4 series that won't break compatibility within the Enterprise Linux release. Occassionally, code that was not compliant to standards may fail to compile or its functionality may change in the process of fixing bugs or maintaining standards compliant behavior.
Since the previous release of Red Hat Enterprise Linux, GCC has had three major releases: 4.2.x, 4.3.x, and 4.4.x. A selective summary of the expansive list of changes follows.
  • The inliner, dead code elimination routines, compile time, and memory usage codes are now improved. This release also features a new register allocator, instruction scheduler, and software pipeliner.
  • Version 3.0 of the OpenMP specification is now supported for the C, C++, and Fortran compilers.
  • Experimental support for the upcoming ISO C++ standard (C++0x) is included. This has support for auto/inline namespaces, character types, and scoped enumerations. To enable this, use the compiler options -std=c++0x (which disables GNU extensions) or -std=gnu++0x.
    For a more detailed list of the status of C++0x improvements, refer to:
  • GCC now incorporates the Variable Tracking at Assignments (VTA) infrastructure. This allows GCC to better track variables during optimizations so that it can produce improved debugging information (i.e. DWARF) for the Gnome Debugger, SystemTap, and other tools. For a brief overview of VTA, refer to Section 5.3, “Variable Tracking at Assignments”.
    With VTA you can debug optimized code drastically better than with previous GCC releases, and you do not have to compile with -O0 to provide a better debugging experience.
  • Fortran 2008 is now supported, while support for Fortran 2003 is extended.
For a more detailed list of improvements in GCC, refer to:
In addition to the changes introduced via the GCC 4.4 rebase, the Red Hat Enterprise Linux 6 version of GCC also features several fixes and enhancements backported from upstream sources (i.e. version 4.5 and beyond). These improvements include the following (among others):
  • Improved DWARF3 debugging for debugging optimized C++ code.
  • Fortran optimization improvements.
  • More accurate instruction length information for ix86, Intel 64 and AMD64, and s390.
  • Intel Atom support
  • POWER7 support
  • C++ raw string support, u/U/u8 string literal support

4.1.2. Language Compatibility

Application Binary Interfaces specified by the GNU C, C++, Fortran and Java Compiler include:
  • Calling conventions. These specify how arguments are passed to functions and how results are returned from functions.
  • Register usage conventions. These specify how processor registers are allocated and used.
  • Object file formats. These specify the representation of binary object code.
  • Size, layout, and alignment of data types. These specify how data is laid out in memory.
  • Interfaces provided by the runtime environment. Where the documented semantics do not change from one version to another they must be kept available and use the same name at all times.
The default system C compiler included with Red Hat Enterprise Linux 6 is largely compatible with the C99 ABI standard. Deviations from the C99 standard in GCC 4.4 are tracked online.
In addition to the C ABI, the Application Binary Interface for the GNU C++ Compiler specifies the binary interfaces needed to support the C++ language, such as:
  • Name mangling and demangling
  • Creation and propagation of exceptions
  • Formatting of run-time type information
  • Constructors and destructors
  • Layout, alignment, and padding of classes and derived classes
  • Virtual function implementation details, such as the layout and alignment of virtual tables
The default system C++ compiler included with Red Hat Enterprise Linux 6 conforms to the C++ ABI defined by the Itanium C++ ABI (1.86).
Although every effort has been made to keep each version of GCC compatibile with previous releases, some incompatibilities do exist.
ABI incompatibilities between RHEL6 and RHEL5
The following is a list of known incompatibilities between the Red Hat Enterprise Linux 6 and 5 toolchains.
  • Passing/returning structs with flexible array members by value changed in some cases on Intel 64 and AMD64.
  • Passing/returning of unions with long double members by value changed in some cases on Intel 64 and AMD64.
  • Passing/returning structs with complex float member by value changed in some cases on Intel 64 and AMD64.
  • Passing of 256-bit vectors on x86, Intel 64 and AMD64 platforms changed when -mavx is used.
  • There have been multiple changes in passing of _Decimal{32,64,128} types and aggregates containing those by value on several targets.
  • Packing of packed char bitfields changed in some cases.
ABI incompatibilities between RHEL5 and RHEL4
The following is a list of known incompatibilities between the Red Hat Enterprise Linux 5 and 4 toolchains.
  • There have been changes in the library interface specified by the C++ ABI for thread-safe initialization of function-scope static variables.
  • On Intel 64 and AMD64, the medium model for building applications where data segment exceeds 4GB, was redesigned to match the latest ABI draft at the time. The ABI change results in incompatibility among medium model objects.
The compiler flag -Wabi can be used to get diagnostics indicating where these constructs appear in source code, though it will not catch every single case. This flag is especially useful for C++ code to warn whenever the compiler generates code that is known to be incompatible with the vendor-neutral C++ ABI.
Excluding the incompatibilities listed above, the GCC C and C++ language ABIs are mostly ABI compatible. The vast majority of source code will not encounter any of the known issues, and can be considered compatible.
Compatible ABIs allow the objects created by compiling source code to be portable to other systems. In particular, for Red Hat Enterprise Linux, this allows for upward compatibility. Upward compatibility is defined as the ability to link shared libraries and objects, created using a version of the compilers in a particular RHEL release, with no problems. This includes new objects compiled on subsequent RHEL releases.
The C ABI is considered to be stable, and has been so since at least RHEL3 (again, barring any incompatibilities mentioned in the above lists). Libraries built on RHEL3 and later can be linked to objects created on a subsequent environment (RHEL4, RHEL5, and RHEL6).
The C++ ABI is considered to be stable, but less stable than the C ABI, and only as of RHEL4 (corresponding to GCC version 3.4 and above.). As with C, this is only an upward compatibility. Libraries built on RHEL4 and above can be linked to objects created on a subsequent environment (RHEL5, and RHEL6).
To force GCC to generate code compatible with the C++ ABI in RHEL releases prior to RHEL4, some developers have used the -fabi-version=1 option. This practice is not recommended. Objects created this way are indistinguishable from objects conforming to the current stable ABI, and can be linked (incorrectly) amongst the different ABIs, especially when using new compilers to generate code to be linked with old libraries that were built with tools prior to RHEL4.

Warning

The above incompatibilities make it incredibly difficult to maintain ABI shared library sanity between releases, especially if when developing custom libraries with multiple dependencies outside of the core libraries. Therefore, if shared libraries are developed, it is highly recommend that a new version is built for each Red Hat Enterprise Linux release.

4.1.3. Object Compatibility and Interoperability

Two items that are important are the changes and enhancements in the underlying tools used by the compiler, and the compatibility between the different versions of a language's compiler.
Changes and new features in tools like ld (distributed as part of the binutils package) or in the dynamic loader (ld.so, distributed as part of the glibc package) can subtly change the object files that the compiler produces. These changes mean that object files moving to the current release of Red Hat Enterprise Linux from previous releases may loose functionality, behave differently at runtime, or otherwise interoperate in a diminished capacity. Known problem areas include:
  • ld --build-id
    In RHEL6 this is passed to ld by default, whereas RHEL5 ld doesn't recognize it.
  • as .cfi_sections support
    In RHEL6 this directive allows .debug_frame, .eh_frame or both to be emitted from .cfi* directives. In RHEL5 only .eh_frame is emitted.
  • as, ld, ld.so, and gdb STB_GNU_UNIQUE and %gnu_unique_symbol support
    In RHEL6 more debug information is generated and stored in object files. This information relies on new features detailed in the DWARF standard, and also on new extensions not yet standardized. In RHEL5, tools like as, ld, gdb, objdump, and readelf may not be prepared for this new information and may fail to interoperate with objects created with the newer tools. In addition, RHEL5 produced object files do not support these new features; these object files may be handled by RHEL6 tools in a sub-optimal manner.
    An outgrowth of this enhanced debug information is that the debuginfo packages that ship with system libraries allow you to do useful source level debugging into system libraries if they are installed. Refer to Section 5.1, “Installing Debuginfo Packages” for more information on debuginfo packages.
Object file changes, such as the ones listed above, may interfere with the portable use of prelink.

4.1.4. Backwards Compatibility Packages

Several packages are provided to serve as an aid for those moving source code or executables from older versions of Red Hat Enterprise Linux to the current release. These packages are intended to be used as a temporary aid in transitioning sources to newer compilers with changed behavior, or as a convenient way to otherwise isolate differences in the system environment from the compile environment.

Note

Please be advised that Red Hat may remove these packages in future Red Hat Enterprise Linux releases.
The following packages provide compatibility tools for compiling Fortran or C++ source code on the current release of Red Hat Enterprise Linux 6 as if one was using the older compilers on Red Hat Enterprise Linux 4:
  • compat-gcc-34
  • compat-gcc-34-c++
  • compat-gcc-34-g77
The following package provides a compatibility runtime library for Fortran exectuables compiled on Red Hat Enterprise Linux 5 to run without recompilation on the current release of Red Hat Enterprise Linux 6:
  • compat-libgfortran-41
Please note that backwards compatibility library packages are not provided for all supported system libraries, just the system libraries pertaining to the compiler and the C/C++ standard libraries.
For more information about backwards compatibility library packages, refer to the Application Compatibility section of the Red Hat Enterprise Linux 6 Migration Guide.

4.1.5. Previewing RHEL6 compiler features on RHEL5

On Red Hat Enterprise Linux 5, we have included the package gcc44 as an update. This is a backport of the RHEL6 compiler to allow users running RHEL5 to compile their code with the RHEL6 compiler and experiment with new features and optimizations before upgrading their systems to the next major release. The resulting binary will be forward compatible with RHEL6, so one can compile on RHEL5 with gcc44 and run on RHEL5, RHEL6, and above.
The RHEL5 gcc44 compiler will be kept reasonably in step with the GCC 4.4.x that we ship with RHEL6 to ease transition. Though, to get the latest features, it is recommended RHEL6 is used for development. The gcc44 is only provided as an aid in the conversion process.

4.1.6. Running GCC

To compile using GCC tools, first install binutils and gcc; doing so will also install several dependencies.
In brief, the tools work via the gcc command. This is the main driver for the compiler. It can be used from the command line to pre-process or compile a source file, link object files and libraries, or perform a combination thereof. By default, gcc takes care of the details and links in the provided libgcc library.
The compiler functions provided by GCC are also integrated into the Eclipse IDE as part of the CDT. This presents many advantages, particularly for developers who prefer a graphical interface and fully integrated environment. For more information about compiling in Eclipse, refer to Section 1.3, “ Development Toolkits”.
Conversely, using GCC tools from the command-line interface consumes less system resources. This also allows finer-grained control over compilers; GCC's command-line tools can even be used outside of the graphical mode (runlevel 5).

4.1.6.1. Simple C Usage

Basic compilation of a C language program using GCC is easy. Start with the following simple program:
hello.c
#include <stdio.h>

int main ()
{
  printf ("Hello world!\n");
  return 0;
}
The following procedure illustrates the compilation process for C in its most basic form.
Procedure 4.1. Compiling a 'Hello World' C Program
  1. Compile hello.c into an executable with:
    gcc hello.c -o hello
    Ensure that the resulting binary hello is in the same directory as hello.c.
  2. Run the hello binary, i.e. hello.

4.1.6.2. Simple C++ Usage

Basic compilation of a C++ language program using GCC is similar. Start with the following simple program:
hello.cc
#include <iostream>

using namespace std;

int main(void)
{
  cout << "Hello World!" << endl;
  return 0;
}
The following procedure illustrates the compilation process for C++ in its most basic form.
Procedure 4.2. Compiling a 'Hello World' C++ Program
  1. Compile hello.cc into an executable with:
    g++ hello.cc -o hello
    Ensure that the resulting binary hello is in the same directory as hello.cc.
  2. Run the hello binary, i.e. hello.

4.1.6.3. Simple Multi-File Usage

To use basic compilation involving multiple files or object files, start with the following two source files:
one.c
#include <stdio.h>
void hello()
{
  printf("Hello world!\n");
}
two.c
extern void hello();

int main()
{
  hello();
  return 0;
}
The following procedure illustrates a simple, multi-file compilation process in its most basic form.
Procedure 4.3. Compiling a Program with Muiltiple Source Files
  1. Compile one.c into an executable with:
    gcc -c one.c -o one.o
    Ensure that the resulting binary one.o is in the same directory as one.c.
  2. Compile two.c into an executable with:
    gcc -c two.c -o two.o
    Ensure that the resulting binary two.o is in the same directory as two.c.
  3. Compile the two object files one.o and two.o into a single executable with:
    gcc one.o two.o -o hello
    Ensure that the resulting binary hello is in the same directory as one.o and two.o.
  4. Run the hello binary, i.e. hello.

4.1.6.4. Recommended Optimization Options

Different projects require different optimization options. There is no one-size-fits-all approach when it comes to optimization, but here are a few guidelines to keep in mind.
Instruction selection and tuning
It is very important to chose the correct architecture for instruction scheduling. By default GCC produces code is optimized for the most common processors, but if the CPU on which your code will run is known, the corresponding -mtune= option to optimize the instruction scheduling, and -march= option to optimize the instruction selection should be used.
The option -mtune= optimizes instruction scheduling to fit your architecture by tuning everything except the ABI and the available instruction set. This option will not chose particular instructions, but instead will tune your program in such a way that executing on a particular architecture will be optimized. For example, if an Intel Core2 CPU will predominantly be used, choose -march=core2. If the wrong choice is made, the program will still run, but not optimally on the given architecture. The architecture on which the program will most likely run should always be chosen.
The option -march= optimizes instruction selection. As such, it is important to choose correctly as choosing incorrectly will cause your program to fail. This option selects the instruction set used when generating code. For example, if the program will be run on an AMD K8 core based CPU, choose -march=k8. Specifying the architecture with this option will imply -mtune=.
The -mtune= and -march= commands should only be used for tuning and selecting instructions within a given architecture, not to generate code for a different architecture (also known as cross-compiling). For example, this is not to be used to generate PowerPC code from an Intel 64 and AMD64 platform.
For a complete list of the available options for both -march= and -mtune=, refer to the GCC documention available here: GCC 4.4.4 Manual: Hardware Models and Configurations
General purpose optimization flags
The compiler flag -O2 is a good middle of the road option to generate fast code. It produces the best optimized code when the resulting code size is not large. Use this when unsure what would best suit.
When code size is not an issue, -O3 is preferrable. This option produces code that is slightly larger but runs faster because of a more frequent inline of functions. This is ideal for floating point intensive code.
The other general purpose optimization flag is -Os. This flag also optimizes for size, and produces faster code in situations where a smaller footprint will increase code locality, thereby reducing cache misses.
Use -frecord-gcc-switches when compiling objects. This records the options used to build objects into objects themselves. After an object is built, it determines which set of options were used to build it. The set of options are then recorded in a section called .GCC.command.line within the object and can be examined with the following:
$ gcc -frecord-gcc-switches -O3 -Wall hello.c -o hello
$ readelf --string-dump=.GCC.command.line hello

String dump of section '.GCC.command.line':
  [     0]  hello.c
  [     8]  -mtune=generic
  [    17]  -O3
  [    1b]  -Wall
  [    21]  -frecord-gcc-switches
It is very important to test and try different options with a representative data set. Often, different modules or objects can be compiled with different optimization flags in order to produce optimal results. Refer to Section 4.1.6.5, “Using Profile Feedback to Tune Optimization Heuristics.” for additional optimization tuning.

4.1.6.5. Using Profile Feedback to Tune Optimization Heuristics.

During the transformation of a typical set of source code into an executable, tens of hundreds of choices must be made about the importance of speed in one part of code over another, or code size as opposed to code speed. By default, these choices are made by the compiler using reasonable heuristics, tuned over time to produce the optimum runtime performance. However, GCC also has a way to teach the compiler to optimize executables for a specific machine in a specific production environment. This feature is called profile feedback.
Profile feedback is used to tune optimizations such as:
  • Inlining
  • Branch prediction
  • Instruction scheduling
  • Inter-procedural constant propagation
  • determining of hot or cold functions
Profile feedback compiles a program first to generate a program that is run and analyzed and then a second time to optimize with the gathered data.
Procedure 4.4. Using Profile Feedback
  1. Step One

    The application must be instrumented to produce profiling information by compiling it with -fprofile-generate.
  2. Step Two

    Run the application to accumulate and save the profiling information.
  3. Step Three

    Recompile the application with -fprofile-use.
Step three will use the profile information gathered in step one to tune the compiler's heuristics while optimizing the code into a final executable.
Procedure 4.5. Compiling a Program with Profiling Feedback
  1. Compile source.c to include profiling instrumentation:
    gcc source.c -fprofile-generate -O2 -o executable
  2. Run executable to gather profiling information:
    ./executable
  3. Recompile and optimize source.c with profiling information gathered in step one:
    gcc source.c -fprofile-use -O2 -o executable
Multiple data collection runs, as seen in step two, will accumulate data into the profiling file instead of replacing it. This allows the executable in step two to be run multiple times with additional representative data in order to collect even more information.
The executable must run with representative levels of both the machine being used and a respective data set large enough for the input needed. This ensures optimal results are achieved.
By default, GCC will generate the profile data into the directory where step one was performed. To generate this information elsewhere, compile with -fprofile-dir=DIR where DIR is the preferred output directory.

Warning

The format of the compiler feedback data file changes between compiler versions. It is imperative that the program compilation is repeated with every new version of the compiler.

4.1.6.6. Using 32-bit compilers on a 64-bit host

On a 64-bit host, GCC will build executables that can only run on 64-bit hosts. However, GCC can be used to build executables that will run both on 64-bit hosts and on 32-bit hosts.
To build 32-bit binaries on a 64-bit host, first install 32-bit versions of any supporting libraries the executable may need. This must at least include supporting libraries for glibc and libgcc, and possibly for libstdc++ if the program is a C++ program. On Intel 64 and AMD64, this can be done with:
yum install glibc-devel.i686 libgcc.i686 libstdc++-devel.i686
There may be cases where it is useful to to install additional 32-bit libraries that a program may need. For example, if a program uses the db4-devel libraries to build, the 32-bit version of these libraries can be installed with:
yum install db4-devel.i686

Note

The .i686 suffix on the x86 platform (as opposed to x86-64) specifies a 32-bit version of the given package. For PowerPC architectures, the suffix is ppc (as opposed to ppc64).
After the 32-bit libraries have been installed, the -m32 option can be passed to the compiler and linker to produce 32-bit executables. Provided the supporting 32-bit libraries are installed on teh 64-bit system, this executable will be able to run on both 32-bit systems and 64-bit systems.
Procedure 4.6. Compiling a 32-bit Program on a 64-bit Host
  1. On a 64-bit system, compile hello.c into a 64-bit executable with:
    gcc hello.c -o hello64
  2. Ensure that the resulting executable is a 64-bit binary:
    $ file hello64
    hello64: ELF 64-bit LSB executable, x86-64, version 1 (GNU/Linux), dynamically linked (uses shared libs), for GNU/Linux 2.6.18, not stripped
    $ ldd hello64
    linux-vdso.so.1 =>  (0x00007fff242dd000)
    libc.so.6 => /lib64/libc.so.6 (0x00007f0721514000)
    /lib64/ld-linux-x86-64.so.2 (0x00007f0721893000)
    
    The command file on a 64-bit executable will include ELF 64-bit in its output, and ldd will list /lib64/libc.so.6 as the main C library linked.
  3. On a 64-bit system, compile hello.c into a 32-bit executable with:
    gcc -m32 hello.c -o hello32
  4. Ensure that the resulting executable is a 32-bit binary:
    $ file hello32
    hello32: ELF 32-bit LSB executable, Intel 80386, version 1 (GNU/Linux), dynamically linked (uses shared libs), for GNU/Linux 2.6.18, not stripped
    $ ldd hello32
    linux-gate.so.1 =>  (0x007eb000)
    libc.so.6 => /lib/libc.so.6 (0x00b13000)
    /lib/ld-linux.so.2 (0x00cd7000)
    
    The command file on a 32-bit executable will include ELF 32-bit in its output, and ldd will list /lib/libc.so.6 as the main C library linked.
If you have not installed the 32-bit supporting libraries you will get an error similar to this for C code:
$ gcc -m32 hello32.c -o hello32
/usr/bin/ld: crt1.o: No such file: No such file or directory
collect2: ld returned 1 exit status
A similar error would be triggered on C++ code:
$ g++ -m32 hello32.cc -o hello32-c++
In file included from /usr/include/features.h:385,
     from /usr/lib/gcc/x86_64-redhat-linux/4.4.4/../../../../include/c++/4.4.4/x86_64-redhat-linux/32/bits/os_defines.h:39,
     from /usr/lib/gcc/x86_64-redhat-linux/4.4.4/../../../../include/c++/4.4.4/x86_64-redhat-linux/32/bits/c++config.h:243,
     from /usr/lib/gcc/x86_64-redhat-linux/4.4.4/../../../../include/c++/4.4.4/iostream:39,
     from hello32.cc:1:
/usr/include/gnu/stubs.h:7:27: error: gnu/stubs-32.h: No such file or directory
These errors indicate that the supporting 32-bit libraries have not been properly installed as explained at the beginning of this section.
It is important to note that even if 32-bit binaries can run on 64-bit systems, it is preferrable to have 64-bit binaries unless otherwise needed. In order to run 32-bit binaries on 64-bit systems, the system must import additional 32-bit shared libraries that must be loaded in tandem with the 64-bit libraries (for example glibc). This causes additional memory usage on such systems. It is always preferrable to have 64-bit binaries for 64-bit systems and 32-bit binaries for 32-bit systems.
Also important is to note that building with -m32 will in not adapt or convert a program to resolve any issues arising from 32/64-bit incompatibilities. For tips on writing portable code and converting from 32-bits to 64-bits, see the paper entitled Porting to 64-bit GNU/Linux Systems in the Proceedings of the 2003 GCC Developers Summit.

4.1.7. GCC Documentation

For more information about GCC compilers, refer to the man pages for cpp, gcc, g++, gcj, and gfortran.
the following online user manuals are also available:
The main site for the development of GCC is gcc.gnu.org.

4.2. Distributed Compiling

Red Hat Enterprise Linux 6 also supports distributed compiling. This involves transforming one compile job into many smaller jobs; these jobs are distributed over a cluster of machines, which speeds up build time (particularly for programs with large codebases). The distcc package provides this capability.
To set up distributed compiling, install the following packages:
  • distcc
  • distcc-server
For more information about distributed compiling, refer to the man pages for distcc and distccd. The following link also provides detailed information about the development of distcc:

4.3. Autotools

GNU Autotools is a suite of command-line tools that allow developers to build applications on different systems, regardless of the installed packages or even Linux distribution. These tools aid developers in creating a configure script. This script runs prior to builds and creates the top-level Makefiles needed to build the application. The configure script may perform tests on the current system, create additional files, or run other directives as per parameters provided by the builder.
The Autotools suite's most commonly-used tools are:
autoconf
Generates the configure script from an input file (e.g. configure.ac)
automake
Creates the Makefile for a project on a specific system
autoscan
Generates a preliminary input file (i.e. configure.scan), which can be edited to create a final configure.ac to be used by autoconf
All tools in the Autotools suite are part of the Development Tools group package. You can install this package group to install the entire Autotools suite, or simply use yum to install any tools in the suite as you wish.

4.3.1. Autotools Plug-in for Eclipse

The Autotools suite is also integrated into the Eclipse IDE via the Autotools plug-in. This plug-in provides an Eclipse graphical user interface for Autotools, which is suitable for most C/C++ projects.
As of Red Hat Enterprise Linux 6, this plug-in only supports two templates for new C/C++ projects:
  • An empty project
  • A "hello world" application
The empty project template is used when importing projects into the C/C++ Development Toolkit that already support Autotools. Future updates to the Autotools plug-in will include additional graphical user interfaces (e.g. wizards) for creating shared libraries and other complex scenarios.
The Red Hat Enterprise Linux 6 version of the Autotools plug-in also does not integrate git or mercurial into Eclipse. As such, Autotools projects that use git repositories will need to be checked out outside the Eclipse workspace. Afterwards, you can specify the source location for such projects in Eclipse. Any repository manipulation (e.g. commits, updates) will need to be done via the command line.

4.3.2. Configuration Script

The most crucial function of Autotools is the creation of the configure script. This script tests systems for tools, input files, and other features it can use in order to build the project [2]. The configure script generates a Makefile which allows the make tool to build the project based on the system configuration.
To create the configure script, create an input file and feed it to an Autotools utility to create theconfigure script. This input file is typically configure.ac or Makefile.am; the former is usually processed by autoconf, while the latter is fed to automake.
If a Makefile.am input file is available, the automake utility creates a Makefile template (i.e. Makefile. in), which may refer to information collected at configuration time. For example, the Makefile may need to link to a particular library if and only if that library is already installed. When the configure script runs, automake will use the Makefile. in templates to create a Makefile.
If a configure.ac file is available instead, then autoconf will automatically create the configure script based on the macros invoked by configure.ac. To create a preliminary configure.ac, use the autoscan utility and edit the file accordingly.

4.3.3. Autotools Documentation

Red Hat Enterprise Linux 6 includes man pages for autoconf, automake, autoscan and most tools included in the Autotools suite. In addition, the Autotools community provides extensive documentation on autoconf and automake on the following websites:
The following is an online book describing the use of Autotools. Although the above online documentation is the recommended and most up to date information on Autotools, this book is a good alternative and introduction.
For information on how to create Autotools input files, refer to:
The following upstream example also illustrates the use of Autotools in a simple hello program:
The Autotools Plug-in For Eclipse whitepaper also provides more detail on the Red Hat Enterprise Linux 6 release of the Autotools plug-in. This whitepaper also includes a "by example" case study to walk you through a typical use-case for the plug-in. Refer to the following link for more information:

4.4. Eclipse Built-in Specfile Editor

The Specfile Editor Plug-in for Eclipse provides useful features to help developers manage .spec files. This plug-in allows users to leverage several Eclipse GUI features in editing .spec files, such as auto-completion, highlighting, file hyperlinks, and folding.
In addition, the Specfile Editor Plug-in also integrates the rpmlint tool into the Eclipse interface. rpmlint is a command-line tool that helps developers detect common RPM package errors. The richer visualization offered by the Eclipse interface helps developers quickly detect, view, and correct mistakes reported by rpmlint.
The Specfile Editor for Eclipse is provided by the eclipse-rpm-editor package. For more information about this plug-in, refer to Specfile Editor User Guide in the Eclipse Help Contents.


[2] For information about tests that configure can perform, refer to the following link:

Chapter 5. Debugging

5.1. Installing Debuginfo Packages
5.2. GDB
5.2.1. Simple GDB
5.2.2. Running GDB
5.2.3. Conditional Breakpoints
5.2.4. Forked Execution
5.2.5. Threads
5.2.6. GDB Variations and Environments
5.2.7. GDB Documentation
5.3. Variable Tracking at Assignments
5.4. Python Pretty-Printers
Useful, well-written software generally goes through different phases of application development, and mistakes can occur in each phase. Some phases come with their own set of mechanisms to detect certain mistakes; during compilation, for example, most compilers perform elementary semantic analysis, making sure objects such as variables and functions are adequately described.
The error-checking mechanisms of each application development phase helps catch simple and obvious mistakes in code. The debugging phase helps catch more subtle errors; ones that fell through the cracks during routine code inspection.

5.1. Installing Debuginfo Packages

Red Hat Enterprise Linux also provides -debuginfo packages for all architecture-dependent RPMs included in the operating system. A -debuginfo package contains accurate debugging information for its corresponding package. To install the -debuginfo package of a package (i.e. typically packagename-debuginfo), use the following command:
debuginfo-install packagename

Note

Attempting to debug a package without having its -debuginfo equivalent installed may fail, although GDB will try to provide any helpful diagnostics it can.

5.2. GDB

Fundamentally, like most debuggers, GDB manages the execution of compiled code in a very closely controlled environment. This environment makes possible the following fundamental mechanisms necessary to the operation of GDB:
  • Inspect and modify memory within the code being debugged (e.g. reading and setting variables).
  • Control the execution state of the code being debugged, principally whether it's running or stopped.
  • Detect the execution of particular sections of code (e.g. stop running code when it reaches a specified area of interest to the programmer).
  • Detect access to particular areas of memory (e.g. stop running code when it accesses a specified variable).
  • Execute portions of code (from an otherwise stopped program) in a controlled manner.
  • Detect various programmatic asynchronous events such as signals.
The operation of these mechanisms rely mostly on information produced by a compiler. For example, to view the value of a variable, GDB has to know:
  • The location of the variable in memory
  • The nature of the variable
This means that displaying a double-precision floating point value requires a very different process from displaying a string of characters. For something complex like a structure, GDB has to know not only the characteristics of each individual elements in the structure, but the morphology of the structure as well.
GDB requires the following items in order to fully function:
Debug Information
Much of GDB's operations rely on a program's debug information. While this information generally comes from compilers, much of it is necessary only while debugging a program, i.e. it is not used during the program's normal execution. For this reason, compilers do not always make that information available by default — GCC, for instance, must be explicitly instructed to provide this debugging information with the -g flag.
To make full use of GDB's capabilities, it is highly advisable to make the debug information available first to GDB. GDB can only be of very limited use when run against code with no available debug information.
Source Code
One of the most useful features of GDB (or any other debugger) is the ability to associate events and circumstances in program execution with their corresponding location in source code. This location normally refers to a specific line or series of lines in a source file. This, of course, would require that a program's source code be available to GDB at debug time.

5.2.1. Simple GDB

GDB literally contains dozens of commands. This section describes the most fundamental ones.
br (breakpoint)
The breakpoint command instructs GDB to halt execution upon reaching a specified point in the execution That point can be specified a number of ways, but the most common are just as the line number in the source file, or the name of a function. Any number of breakpoints can be in effect simultaneously. This is frequently the first command issued after starting GDB.
r (run)
The run command starts the execution of the program. If run is executed with any arguments, those arguments are passed on to the executable as if the program has been started normally. Users normally issue this command after setting breakpoints.
Before an executable is started, or once the executable stops at, for example, a breakpoint, the state of many aspects of the program can be inspected. The following commands are a few of the more common ways things can be examined.
p (print)
The print command displays the value of the argument given, and that argument can be almost anything relevant to the program. Usually, the argument is simply the name of a variable of any complexity, from a simple single value to a structure. An argument can also be an expression valid in the current language, including the use of program variables and library functions, or functions defined in the program beingtested.
bt (backtrace)
The backtrace displays the chain of function calls used up until the exectuion was terminated. This is useful for investigating serious bugs (such as segmentation faults) with elusive causes.
l (list)
When execution is stopped, the list command shows the line in the source code corresponding to where the program stopped.
The execution of a stopped program can be resumed in a number of ways. The following are the most common.
c (continue)
The continue command simply restarts the execution of the program, which will continue to execute until it encounters a breakpoint, runs into a specified or emergent condition (e.g. an error), or terminates.
n (next)
Like continue, the next command also restarts execution; however, in addition to the stopping conditions implicit in the continue command, next will also halt execution at the next sequential line of code in the current source file.
s (step)
Like next, the step command also halts execution at each sequential line of code in the current source file. However, if execution is currently stopped at a source line containing a function call, GDB stops execution after entering the function call (rather than executing it).
fini (finish)
Like the aforementioned commands, the finish command resumes executions, but halts when execution returns from a function.
Finally, two essential commands:
q (quit)
This terminates the execution.
h (help)
The help command provides access to its extensive internal documentation. The command takes arguments: help breakpoint (or h br), for example, shows a detailed description of the breakpoint command. Refer to the help output of each command for more detailed information.

5.2.2. Running GDB

This section will describe a basic execution of GDB, using the following simple program:
hello.c
#include <stdio.h>
    
    char hello[] = { "Hello, World!" };

    int
    main()
    {
      fprintf (stdout, "%s\n", hello);
      return (0);
    }
The following procedure illustrates the debugging process in its most basic form.
Procedure 5.1. Debugging a 'Hello World' Program
  1. Compile hello.c into an executable with the debug flag set, as in:
    gcc -g -o hello hello.c
    Ensure that the resulting binary hello is in the same directory as hello.c.
  2. Run gdb on the hello binary, i.e. gdb hello.
  3. After several introductory comments, gdb will display the default GDB prompt:
    (gdb)
  4. Some things can be done even before execution is started. The variable hello is global, so it can be seen even before the main procedure starts:
        gdb) p hello
        $1 = "Hello, World!"
        (gdb) p hello[0]
        $2 = 72 'H'
        (gdb) p *hello
        $3 = 72 'H'
        (gdb)
    
    Note that the print targets hello[0] and *hello require the evaluation of an expression, as does, for example, *(hello + 1):
        (gdb) p *(hello + 1)
        $4 = 101 'e'
    
  5. Next, list the source:
        (gdb) l
        1       #include <stdio.h>
        2
        3       char hello[] = { "Hello, World!" };
        4
        5       int
        6       main()
        7       {
        8         fprintf (stdout, "%s\n", hello);
        9         return (0);
        10      }
    
    The list reveals that the fprintf call is on line 8. Apply a breakpoint on that line and resume the code:
        (gdb) br 8
        Breakpoint 1 at 0x80483ed: file hello.c, line 8.
        (gdb) r
        Starting program: /home/moller/tinkering/gdb-manual/hello
    
        Breakpoint 1, main () at hello.c:8
        8         fprintf (stdout, "%s\n", hello);
    
  6. Finally, use the next command to step past the fprintf call, executing it:
        (gdb) n
        Hello, World!
        9         return (0);
    
The following sections describe more complex applications of GDB.

5.2.3. Conditional Breakpoints

In many real-world cases, a program may perform its task well during the first few thousand times; it may then start crashing or encountering errors during its eight thousandth iteration of the task. Debugging programs like this can be difficult, as it is hard to imagine a programmer with the patience to issue a continue command thousands of times just to get to the iteration that crashed.
Situations like this are common in real life, which is why GDB allows programmers to attach conditions to a breakpoint. For example, consider the following program:
simple.c
      #include <stdio.h>
      
      main()
      {
        int i;

        for (i = 0;; i++) {
          fprintf (stdout, "i = %d\n", i);
        }
      }
To set a conditional breakpoint at the GDB prompt:
      (gdb) br 8 if i == 8936
      Breakpoint 1 at 0x80483f5: file iterations.c, line 8.
      (gdb) r
With this condition, the program execution will eventually stop with the following output:
      i = 8931
      i = 8932
      i = 8933
      i = 8934
      i = 8935
      
      Breakpoint 1, main () at iterations.c:8
      8           fprintf (stdout, "i = %d\n", i);
Inspect the breakpoint information (using info br) to review the breakpoint status:
      (gdb) info br
      Num     Type           Disp Enb Address    What
      1       breakpoint     keep y   0x080483f5 in main at iterations.c:8
              stop only if i == 8936
              breakpoint already hit 1 time

5.2.4. Forked Execution

Among the more challenging bugs that can confront programmers is where one program (the parent) makes an independent copy of itself (a fork) that creates a child process which, in turn, fails. Debugging the parent process may or may not be useful—the only way to get to the bug may be by debugging the child process, but doing a gdb child isn't always possible.
To address this, GDB allows programmers to continue following the parent process after a fork, or to follow a child process.

Note

This capability is not supported by all architectures for which GDB is built, but even under those circumstances using GDB to follow a fork can still be possible. In such architectures, GDB can attach itself to a process that is already running, allowing a second instance of GDB to attach to a forked child process.

5.2.5. Threads

In most cases, a forked program immediately uses one of the variations of the exec function to start a completely independent executable. In the same manner, threads use multiple paths of execution, occurring simultaneously in the same executable. This can provide a whole new range of debugging challenges, such as setting a breakpoint for a particular thread that won't interrupt the execution of any other thread. GDB supports threaded debugging (but not in all architectures for which GDB can be built).

5.2.6. GDB Variations and Environments

GDB normally uses a command-line interface, a CLI, but it also includes what's called a machine interface, the MI. Internally, Eclipse invokes GDB using the MI but a number of other applications similarly use MI to provide different user interfaces.
Emacs, oddly enough, also supports GDB. It offers a collection of major modes that provide an interface to GDB. For more information on this, refer to info emacs; additional information on this is also available from the following link:

5.2.7. GDB Documentation

GDB is a very mature application, literally decades in the making, and is extremely well documented. The most convenient way to access that documentation, and the way most likely to provide documentation on the version of GDB actually installed, is through info gdb; this provides access to the GDB info file included in the GDB installation. In addition, man gdb offers more concise GDB information.
Red Hat also provides extensive GDB documentation on the following link:

Note

Not all documented characteristics will apply to all instances of GDB because it is still in active development, and as such the capabilities vary (to some extent) depending on the platform and target for which it is built.

5.3. Variable Tracking at Assignments

Variable Tracking at Assignments (VTA) is a new infrastructure included in GCC used to improve variable tracking during optimizations. This allows GCC to produce more precise, meaningful, and useful debugging information for GDB, SystemTap, and other debugging tools.
When GCC compiles code with optimizations enabled, variables are renamed, moved around, or even removed altogether. As such, optimized compiling can cause a debugger to report that some variables have been "optimized out". With VTA enabled, optimized code is internally annotated to ensure that optimization passes to transparently keep track of each variable's value, regardless of whether the variable is moved or removed.
VTA's benefits are more pronounced when debugging applications with inlined functions. Without VTA, optimization could completely remove some arguments of an inlined function, preventing the debugger from inspecting its value. With VTA, optimization will still happen, and appropriate debugging information will be generated for any missing arguments.
VTA is enabled by default when compiling code with optimizations and debugging information enabled. To disable VTA during such builds, add the -fno-var-tracking-assignments. In addition, the VTA infrastructure includes the new gcc option -fcompare-debug. This option tests code compiled by GCC with debug information and without debug information: the test passes if the two binaries are identical. This test ensures that executable code is not affected by any debugging options, which further ensures that there are no hidden bugs in the debug code. Note that -fcompare-debug adds significant cost in compilation time. Refer to man gcc for details about this option.
For more information about the infrastructure and development of VTA, refer to A Plan to Fix Local Variable Debug Information in GCC, available at the following link:
A slide deck version of this whitepaper is also available at http://people.redhat.com/aoliva/papers/vta/slides.pdf.

5.4. Python Pretty-Printers

The GDB command print outputs comprehensive debugging information for a target application. GDB aims to provide as much debugging data as it can to users; however, this means that for highly complex programs the amount of data can become very cryptic.
In addition, GDB does not provide any tools that help decipher GDB print output. GDB does not even empower users to easily create tools that can help decipher program data. This makes the practice of reading and understanding debugging data quite arcane, particularly for large, complex projects.
For most developers, the only way to customize GDB print output (and make it more meaningful) is to revise and recompile GDB. However, very few developers can actually do this. Further, this practice will not scale well, particularly if the developer needs to also debug other programs that are heterogenous and contain equally complex debugging data.
To address this, the Red Hat Enterprise Linux 6 version of GDB is now compatible with Python pretty-printers. This allows the retrieval of more meaningful debugging data by leaving the introspection, printing, and formatting logic to a third-party Python script.
Compatibility with Python pretty-printers gives you the chance to truly customize GDB output as you see fit. This makes GDB a more viable debugging solution to a wider range of projects, since you now have the flexibility to adapt GDB output as needed, and with greater ease. Further, developers with intimate knowledge of a project and a specific programming language are best qualified in deciding what kind of output is meaningful, allowing them to improve the usefulness of that output.
The Python pretty-printers implementation allows users to automatically inspect, format, and print program data according to specification. These specifications are written as rules implemented via Python scripts. This offers the following benefits:
Safe
To pass program data to a set of registered Python pretty-printers, the GDB development team added hooks to the GDB printing code. These hooks were implemented with safety in mind: the built-in GDB printing code is still intact, allowing it to serve as a default fallback printing logic. As such, if no specialized printers are available, GDB will still print debugging data the way it always did. This ensures that GDB is backwards-compatible; users who have no need of pretty-printers can still continue using GDB.
Highly Customizable
This new "Python-scripted" approach allows users to distill as much knowledge as required into specific printers. As such, a project can have an entire library of printer scripts that parses program data in a unique manner specific to its user's needs. There is no limit to the number of printers a user can build for a specific project; what's more, being able to customize debugging data script by script offers users an easier way to re-use and re-purpose printer scripts — or even a whole library of them.
Easy to Learn
The best part about this approach is its lower barrier to entry. Python scripting is quite easy to learn (in comparison, at least) and has a large library of free documentation available online. In addition, most programmers already have basic to intermediate experience in Python scripting, or in scripting in general.
The GDB and Python Pretty-Printers whitepaper provides more details on this feature. This whitepaper also includes details and examples on how to write your own Python pretty-printer as well as how to import it into GDB. Refer to the following link for more information:

Chapter 6. Profiling

6.1. Profiling In Eclipse
6.2. Valgrind
6.2.1. Valgrind Tools
6.2.2. Using Valgrind
6.2.3. Valgrind Plug-in for Eclipse
6.2.4. Valgrind Documentation
6.3. OProfile
6.3.1. OProfile Tools
6.3.2. Using OProfile
6.3.3. OProfile Plug-in For Eclipse
6.3.4. OProfile Documentation
6.4. SystemTap
6.4.1. SystemTap Compile Server
6.4.2. SystemTap Support for Unprivileged Users
6.4.3. SSL and Certificate Management
6.4.4. SystemTap Documentation
6.5. Eclipse-Callgraph
6.5.1. Launching a Profile With Eclipse-Callgraph
6.5.2. The Callgraph View
6.6. Performance Counters for Linux (PCL) Tools and perf
6.6.1. Perf Tool Commands
6.6.2. Using Perf
6.7. ftrace
6.7.1. Using ftrace
6.7.2. ftrace Documentation
Developers profile programs to focus attention on the areas of the program that have the largest impact on performance. The types of data collected include what section of the program consumes the most processor time, and where memory is allocated. Profiling collects data from the actual program execution. Thus, the quality of the data collect is influenced by the actual tasks being performed by the program. The tasks performed during profiling should be represenative of actual use; this ensures that problems arising from realistic use of the program are addressed during development.
Red Hat Enterprise Linux 6 includes a number of different tools (Valgrind, OProfile, perf, and SystemTap) to collect profiling data. Each tool is suitable for performing specific types of profile runs, as described in the following sections.

6.1. Profiling In Eclipse

To launch a profile run, navigate to Run > Profile. This will open the Profile As dialogue, from which you can select a tool for a profile run.
Profile As
Figure 6.1. Profile As

To configure each tool for a profile run, navigate to Run > Profile Configuration. This will open the Profile Configuration menu.
Profile Configuration
Figure 6.2. Profile Configuration

For more information on configuring and performing a profile run with each tool in Eclipse, refer to Section 6.2.3, “Valgrind Plug-in for Eclipse ”, Section 6.3.3, “OProfile Plug-in For Eclipse ”, and Section 6.5, “ Eclipse-Callgraph”.

6.2.  Valgrind

Valgrind is an instrumentation framework for building dynamic analysis tools that can be used to profile applications in detail. Valgrind tools are generally used to automatically detect many memory management and threading problems. The Valgrind suite also includes tools that allow you to build new profiling tools to suit your needs.
Valgrind provides instrumentation for user-space binaries to check for errors such as use of uninitialized memory, improper allocation/freeing of memory, and improper arguments for systemcalls. Its profiling tools can be used by normal users on most binaries; however, compared to other profilers, Valgrind profile runs are significantly slower. To profile a binary, Valgrind rewrites its executable and instruments the rewritten binary. Valgrind's tools are most useful for looking for memory-related issues in user-space programs; it is not suitable for debugging time-specific issues or kernel-space instrumentation/debugging.

6.2.1. Valgrind Tools

The Valgrind suite is composed of the following tools:
memcheck
This tool detects memory management problems in programs by checking all reads from and writes to memory and intercepting all system calls to malloc, new, free, and delete. Memcheck is perhaps the most used Valgrind tool, as memory management problems can be difficult to detect using other means. Such problems often remain undetected for long periods, eventually causing crashes that are difficult to diagnose.
cachegrind
Cachegrind is a cache profiler that accurately pinpoints sources of cache misses in code by performing a detailed simulation of the I1, D1 and L2 caches in the CPU. It shows the number of cache misses, memory references, and instructions accruing to each line of source code; Cachegrind also provides per-function, per-module, and whole-program summaries, and can even show counts for each individual machine instructions.
callgrind
Like cachegrind, callgrind can model cache behavior. However, the main purpose of callgrind is to record callgraphs data for the executed code.
massif
Massif is a heap profiler; it measures how much heap memory a program uses, providing information on heap blocks, heap administration overheads, and stack sizes. Heap profilers are useful in finding ways to reduce heap memory usage. On systems that use virtual memory, programs with optimized heap memory usage are less likely to run out of memory, and may be faster as they require less paging.
helgrind
In programs that use the POSIX pthreads threading primitives, Helgrind detects synchronisation errors. Such errors are:
  • Misuses of the POSIX pthreads API
  • Potential deadlocks arising from lock ordering problems
  • Data races (i.e. accessing memory without adequate locking)
Valgrind also allows you to develop your own profiling tools. In line with this, Valgrind includes the lackey tool, which is a sample that can be used as a template for generating your own tools.

6.2.2. Using Valgrind

The valgrind package and its dependencies install all the necessary tools for performing a Valgrind profile run. To profile a program with Valgrind, use:
valgrind --tool=toolname program
Refer to Section 6.2.1, “Valgrind Tools” for a list of arguments for toolname. In addition to the suite of Valgrind tools, none is also a valid argument for toolname; this argument allows you to run a program under Valgrind without performing any profiling. This is useful for debugging or benchmarking Valgrind itself.
You can also instruct Valgrind to send all of its information to a specific file. To do so, use the option --log-file=filename. For example, to check the memory usage of the executable file hello and send profile information to output, use:
valgrind --tool=memcheck --log-file=output hello
Refer to Section 6.2.4, “Valgrind Documentation” for more information on Valgrind, along with other available documentation on the Valgrind suite of tools.

6.2.3. Valgrind Plug-in for Eclipse

The Valgrind plug-in for Eclipse (documented herein) integrates several Valgrind tools into Eclipse. This allows Eclipse users to seamlessly include profiling capabilities into their workflow. At present, the Valgrind plug-in for Eclipse supports three Valgrind tools:
  • Memcheck
  • Massif
  • Cachegrind
The Valgrind plug-in for Eclipse is provided by the eclipse-valgrind package. For more information about this plug-in, refer to Valgrind Integration User Guide in the Eclipse Help Contents.

6.2.4. Valgrind Documentation

For more extensive information on Valgrind, refer to man valgrind. Red Hat Enterprise Linux 6 also provides a comprehensive Valgrind Documentation book, available as PDF and HTML in:
  • file:///usr/share/doc/valgrind-version/valgrind_manual.pdf
  • file:///usr/share/doc/valgrind-version/html/index.html
The Valgrind Integration User Guide in the Eclipse Help Contents also also provides detailed information on the setup and usage of the Valgrind plug-in for Eclipse. This guide is provided by the eclipse-valgrind package.

6.3. OProfile

OProfile is a system-wide Linux profiler, capable of running at low overhead. It consists of a kernel driver and a daemon for collecting raw sample data, along with a suite of tools for parsing that data into meaningful information. OProfile is generally used by developers to determine which sections of code consume the most amount of CPU time, and why.
During a profile run, OProfile uses the processor's performance monitoring hardware. Valgrind rewrites the binary of an application, and in turn instruments it. OProfile, on the other hand,simply profiles a running application as-is. It sets up the performance monitoring hardware to take a sample every x number of events (e.g. cache misses or branch instructions). Each sample also contains information on where it occurred in the program.
OProfile's profiling methods consume less resources than Valgrind. However, OProfile requires root privileges. OProfile is useful for finding "hot-spots" in code, and looking for their causes (e.g. poor cache performance, branch mispredictions).
Using OProfile involves starting the OProfile daemon (oprofiled), running the program to be profiled, collecting the system profile data, and parsing it into a more understandable format. OProfile provides several tools for every step of this process.

6.3.1. OProfile Tools

The most useful OProfile commands include the following:
opcontrol
This tool is used to start/stop the OProfile daemon and configure a profile session.
opreport
The opreport command outputs binary image summaries, or per-symbol data, from OProfile profiling sessions.
opannotate
The opannotate command outputs annotated source and/or assembly from the profile data of an OProfile session.
oparchive
The oparchive command generates a directory populated with executable, debug, and OProfile sample files. This directory can be moved to another machine (via tar), where it can be analyzed offline.
opgprof
Like opreport, the opgprof command outputs profile data for a given binary image from an OProfile session. The output of opgprof is in gprof format.
For a complete list of OProfile commands, refer to man oprofile. For detailed information on each OProfile command, refer to its corresponding man page. Refer to Section 6.3.4, “OProfile Documentation” for other available documentation on OProfile.

6.3.2. Using OProfile

The oprofile package and its dependencies install all the necessary utilities for performing an OProfile profile run. To instruct the OProfile to profile all the application running on the system and to group the samples for the shared libraries with the application using the library, run the following command as root:
opcontrol --no-vmlinux --separate=library --start
You can also start the OProfile daemon without collecting system data. To do so, use the option --start-daemon instead. The --stop option halts data collection, while the --shutdown terminates the OProfile daemon.
Use opreport, opannotate, or opgprof to display the collected profiling data. By default, the data collected by the OProfile daemon is stored in /var/lib/oprofile/samples/.

6.3.3. OProfile Plug-in For Eclipse

The OProfile suite of tools provide powerful call profiling capabilities; as a plug-in, these capabilities are well ported into the Eclipse user interface. The OProfile Plug-in provides the following benefits:
Targeted Profiling
The OProfile Plug-in will allow Eclipse users to profile a specific binary, include related shared libraries/kernel modules, and even exclude binaries. This produces very targeted, detailed usage results on each binary, function, and symbol, down to individual line numbers in the source code.
User Interface Fully Integrated into CDT
The plug-in displays enriched OProfile results through Eclipse, just like any other plug-in. Double-clicking on a source line in the results brings users directly to the corresponding line in the Eclipse editor. This allows users to build, profile, and edit code through a single interface, making profiling a convenient experience for Eclipse users. In addition, profile runs are launched and configured the same way as C/C++ applications within Eclipse.
Fully Customizable Profiling Options
The Eclipse interface allows users to configure their profile run using all options available in the OProfile command-line utility. The plug-in supports event configuration based on processor debugging registers (i.e. counters), as well as interrupt-based profiling for kernels or processors that don't support hardware counters.
Ease of Use
The OProfile Plug-in provides generally useful defaults for all options, usable for a majority of profiling runs. In addition, it also features a "one-click profile" that executes a profile run using these defaults. Users can profile applications from start to finish, or select specific areas of code through a manual control dialog.
The OProfile plug-in for Eclipse is provided by the eclipse-oprofile package. For more information about this plug-in, refer to OProfile Integration User Guide in the Eclipse Help Contents (also provided by eclipse-profile).

6.3.4. OProfile Documentation

For a more extensive information on OProfile, refer to man oprofile. Red Hat Enterprise Linux 6 also provides two comprehensive guides to OProfile in file:///usr/share/doc/oprofile-version/:
OProfile Manual
A comprehensive manual with detailed instructions on the setup and use of OProfile is found at file:///usr/share/doc/oprofile-version/oprofile.html
OProfile Internals
Documentation on the internal workings of OProfile, useful for programmers interested in contributing to the OProfile upstream, can be found at file:///usr/share/doc/oprofile-version/internals.html
The OProfile Integration User Guide in the Eclipse Help Contents also provides detailed information on the setup and usage of the OProfile plug-in for Eclipse. This guide is provided by the eclipse-oprofile package.

6.4. SystemTap

SystemTap is a useful instrumentation platform for probing running processes and kernel activity on the Linux system. To execute a probe:
  1. Write SystemTap scripts that specify which system events (e.g. virtual file system reads, packet transmissions) should trigger specified actions (e.g. print, parse, or otherwise manipulate data).
  2. SystemTap translates the script into a C program, which it compiles into a kernel module.
  3. SystemTap loads the kernel module to perform the actual probe.
SystemTap scripts are useful for monitoring system operation and diagnosing system issues with minimal intrusion into the normal operation of the system. You can quickly instrument running system test hypotheses without having to recompile and re-install instrumented code. To compile a SystemTap script that probes kernel-space, SystemTap uses information from three different kernel information packages:
  • kernel-variant-devel-version
  • kernel-variant-debuginfo-version
  • kernel-variant-debuginfo-common-version
These kernel information packages must match the kernel to be probed. In addition, to compile SystemTap scripts for multiple kernels, the kernel information packages of each kernel must also be installed.
The following sections describe new SystemTap features available in the Red Hat Enterprise Linux 6 release.

6.4.1. SystemTap Compile Server

SystemTap in Red Hat Enterprise Linux 6 supports a compile server and client deployment. With this setup, the kernel information packages of all client systems in the network are installed on just one compile server host (or a few). When a client system attempts to compile a kernel module from a SystemTap script, it remotely accesses the kernel information it needs from the centralized compile server host.
A properly configured and maintained SystemTap compile server host offers the following benefits:
  • The system administrator can verify the integrity of kernel information packages before making the packages available to users.
  • The identity of a compile server can be authenticated using the Secure Socket Layer (SSL). SSL provides an encrypted network connection that prevents eavesdropping or tampering during transmission.
  • Individual users can run their own servers and authorize them for their own use as trusted.
  • System administrators can authorize one or more servers on the network as trusted for use by all users.
  • A server that has not been explicitly authorized is ignored, preventing any server impersonations and similar attacks.

6.4.2. SystemTap Support for Unprivileged Users

For security purposes, users in an enterprise setting are rarely given privileged (i.e. root or sudo) access to their own machines. In addition, full SystemTap functionality should also be restricted to privileged users, as this can provide the ability to completely take control of a system.
SystemTap in Red Hat Enterprise Linux 6 features a new option to the SystemTap client: --unprivileged. This option allows an unprivileged user to run stap. Of course, several restrictions apply to unprivileged users that attempt to run stap.

Note

An unprivileged user is a member of the group stapusr but is not a member of the group stapdev (and is not root).
Before loading any kernel modules created by unprivileged users, SystemTap verifies the integrity of the module using standard digital (cryptographic) signing techniques. Each time the --unprivileged option is used, the server checks the script against the constraints imposed for unprivileged users. If the checks are successful, the server compiles the script and signs the resulting module using a self-generated certificate. When the client attempts to load the module, staprun first verifies the signature of the module by checking it against a database of trusted signing certificates maintained and authorized by root.
Once a signed kernel module is successfully verified, staprun is assured that:
  • The module was created using a trusted systemtap server implementation.
  • The module was compiled using the --unprivileged option.
  • The module meets the restrictions required for use by an unprivileged user.
  • The module has not been tampered with since it was created.

6.4.3.  SSL and Certificate Management

SystemTap in Red Hat Enterprise Linux 6 implements authentication and security via certificates and public/private key pairs. It is the responsibility of the system administrator to add the credentials (i.e. certificates) of compile servers to a database of trusted servers. SystemTap uses this database to verify the identity of a compile server that the client attempts to access. Likewise, SystemTap also uses this method to verify kernel modules created by compile servers using the --unprivileged option.

6.4.3.1. Authorizing Compile Servers for Connection

The first time a compile server is started on a server host, the compile server automatically generates a certificate. This certificate verifies the compile server's identity during SSL authentication and module signing.
In order for clients to access the compile server (whether on the same server host or from a client machine), the system administrator must add the compile server's certificate to a database of trusted servers. Each client host intending to use compile servers maintains such a database. This allows individual users to customize their database of trusted servers, which can include a list of compile servers authorized for their own use only.

6.4.3.2. Authorizing Compile Servers for Module Signing (for Unprivileged Users)

Unprivileged users can only load signed, authorized SystemTap kernel modules. For modules to be recognized as such, they have to be created by a compile server whose certificate appears in a database of trusted signers; this database must be maintained on each host where the module will be loaded.

6.4.3.3. Automatic Authorization

Servers started using the stap-server initscript are automatically authorized to receive connections from all clients on the same host.
Servers started by other means are automatically authorized to receive connections from clients on the same host run by the user who started the server. This was implemented with convenience in mind; users are automatically authorized to connect to a server they started themselves, provided that both client and server are running on the same host.
Whenever root starts a compile server, all clients running on the same host automatically recognize the server as authorized. However, Red Hat advises that you refrain from doing so.
Similarly, a compile server initiated through stap-server is automatically authorized as a trusted signer on the host in which it runs. If the compile server was initiated through other means, it is not automatically authorized as such.

6.4.4. SystemTap Documentation

For more detailed information about SystemTap, refer to the following books (also provided by Red Hat):
  • SystemTap Beginner's Guide
  • SystemTap Tapset Reference
  • SystemTap Language Reference (documentation supplied by IBM)
The SystemTap Beginner's Guide and SystemTap Tapset Reference are also available locally when you install the systemtap package:
  • file:///usr/share/doc/systemtap-version/SystemTap_Beginners_Guide/index.html
  • file:///usr/share/doc/systemtap-version/SystemTap_Beginners_Guide.pdf
  • file:///usr/share/doc/systemtap-version/tapsets/index.html
  • file:///usr/share/doc/systemtap-version/tapsets.pdf
The Section 6.4.1, “SystemTap Compile Server”, Section 6.4.2, “SystemTap Support for Unprivileged Users”, and Section 6.4.3, “ SSL and Certificate Management” sections are excerpts from the SystemTap Support for Unprivileged Users and Server Client Deployment whitepaper. This whitepaper also provides more details on each feature, along with a case study to help illustrate their application in a real-world environment.

6.5.  Eclipse-Callgraph

Red Hat Enterprise Linux 6 also includes the Eclipse-Callgraph plug-in, which provides a visual function trace of a program. This allows you to view a visualization of selected (or even all) functions used by the profiled application.
Eclipse-Callgraph uses SystemTap to perform a comprehensive function trace within a program. As such, you will need to install SystemTap along with the required kernel information packages. For more information about SystemTap, refer to Section 6.4, “SystemTap ” and other SystemTap documentation provided by Red Hat.
This plug-in allows you to profile C/C++ projects directly within the Eclipse IDE, providing various runtime details such as:
  • The relationship between function calls
  • Number of times each function was called
  • Time taken by each instance of a function (relative to the program's execution time)
  • Time taken by all instances of a function (relative to program's execution time)

6.5.1. Launching a Profile With Eclipse-Callgraph

To profile an application with Eclipse-Callgraph, simply right-click on a project and navigate to Profile As > Function callgraph. This will open a dialogue from which you can select an executable to profile.
Eclipse-Callgraph Profile
Figure 6.3. Eclipse-Callgraph Profile

After selecting an executable to profile, Eclipse-Callgraph will ask which files to probe. By default, all source files in the project will be selected.
Selecting Files to Probe
Figure 6.4. Selecting Files to Probe

6.5.2. The Callgraph View

The Callgraph view's toolbar allows you to select a perspective and perform other functions. To play a visual representation of a function trace, click the View Menu button then navigate to Goto. This menu will allow you to pause, step through, or mark each function as it executes.
View > Goto
Figure 6.5. View > Goto

You can also save or load a profile run through the View Menu. To do either, navigate to File under the View Menu; this will display different options relating to saving and loading profile runs.
Radial View
Figure 6.6. Radial View

The Radial View displays all functions branching out from main(), with each function represented as a node. A purple node means that the program terminates at the function. A green node signifies that the function call has nested functions, whereas gray nodes signify no nest functions. Double-clicking on a node will show its parent (colored pink) and children. The lines connecting different nodes also display how many times main() called each function.
The left window of the Radial View lists all of the functions shown in the view. This window also allows you to view nested functions, if any. A green bullet point means the program either starts or terminates at that function.
Tree View
Figure 6.7. Tree View

The Tree View is similar to the Radial View, except that it only displays all descendants of a selected node (Radial View only displays functions one call depth away from a selected node). The top left of Tree View also includes a thumbnail viewer to help you navigate through different call depths of the function tree.
Level View
Figure 6.8. Level View

Level View displays all function calls and any nested function calls branching out from a selected node. However, Level View groups all functions of the same call depth together, giving a clearer visualization of a program's function call execution sequences. Level View also lets you navigate through different call depths using the thumbnail viewer's More nodes above and More nodes below buttons.
Thumbnail Viewer
Figure 6.9. Thumbnail Viewer

Aggregate View
Figure 6.10. Aggregate View

The Aggregate View depicts all functions as boxes; the size of each box represents a function's execution time relative to the total running time of the program. Darker-colored boxes represent functions that are called more times relative to others; for example, in Figure 6.10, “Aggregate View”, the CallThisThirtyTimes function is called the most number of times (150).
Collapse Mode
Figure 6.11. Collapse Mode

The Callgraph view's toolbar also features a Collapse Mode button. This groups all identical functions (i.e. those with identical names and call histories) together into one node. Doing so can be helpful in reducing screen clutter for programs where many functions get called multiple times.
Go to Code
To navigate to a function in the code from any view, press Ctrl while double-clicking on its node. Doing so will open the corresponding source file in the Eclipse editor and highlight the function's declaration in the source.

6.6. Performance Counters for Linux (PCL) Tools and perf

Performance Counters for Linux (PCL) is a new kernel-based subsystem that provides a framework for collecting and analyzing performance data. These events will vary based on the performance monitoring hardware and the software configuration of the system. Red Hat Enterprise Linux 6 includes this kernel subsystem to collect data and the user-space tool perf to analyze the collected performance data.
The PCL subsystem can be used to measure hardware events, including retired instructions and processor clock cycles. It can also measure software events, including major page faults and context switches. For example, PCL counters can compute the Instructions Per Clock (IPC) from a process's counts of instructions retired and processor clock cycles. A low IPC ratio indicates the code makes poor use of the CPU. Other hardware events can also be used to diagnose poor CPU performance.
Performance counters can also be configured to record samples. The relative frequency of samples can be used to identify which regions of code have the greatest impact on performance.

6.6.1. Perf Tool Commands

Useful perf commands include the following:
perf stat
This perf command provides overall statistics for common performance events, including instructions executed and clock cycles consumed. Options allow selection of events other than the default measurement events.
perf record
This perf command records performance data into a file which can be later analyzed using perf report.
perf report
This perf command reads the performance data from a file and analyzes the recorded data.
perf list
This perf command lists the events available on a particular machine. These events will vary based on the performance monitoring hardware and the software configuration of the system.
Use perf help to obtain a complete list of perf commands. To retrieve man page information on each perf command, use perf help command.

6.6.2. Using Perf

Using the basic PCL infrastructure for collecting statistics or samples of program execution is relatively straightforward. This section provides simple examples of overall statistics and sampling.
To collect statistics on make and its children, use the following command:
perf stat -- make all
The perf command will collect a number of different hardware and software counters. It will then print the following information:
Performance counter stats for 'make all':

  244011.782059  task-clock-msecs         #      0.925 CPUs 
          53328  context-switches         #      0.000 M/sec
            515  CPU-migrations           #      0.000 M/sec
        1843121  page-faults              #      0.008 M/sec
   789702529782  cycles                   #   3236.330 M/sec
  1050912611378  instructions             #      1.331 IPC  
   275538938708  branches                 #   1129.203 M/sec
     2888756216  branch-misses            #      1.048 %    
     4343060367  cache-references         #     17.799 M/sec
      428257037  cache-misses             #      1.755 M/sec

  263.779192511  seconds time elapsed
The perf tool can also record samples. For example, to record data on the make command and its children, use:
perf record -- make all
This will print out the file in which the samples are stored, along with the number of samples collected:
[ perf record: Woken up 42 times to write data ]
[ perf record: Captured and wrote 9.753 MB perf.data (~426109 samples) ]
You can then analyze perf.data to determine the relative frequency of samples. The report output includes the command, object, and function for the samples. Use perf report to output an analysis of perf.data. For example, the following command produces a report of the executable that consumes the most time:
perf report --sort=comm
The resulting output:
# Samples: 1083783860000
#
# Overhead          Command
# ........  ...............
#
    48.19%         xsltproc
    44.48%        pdfxmltex
     6.01%             make
     0.95%             perl
     0.17%       kernel-doc
     0.05%          xmllint
     0.05%              cc1
     0.03%               cp
     0.01%            xmlto
     0.01%               sh
     0.01%          docproc
     0.01%               ld
     0.01%              gcc
     0.00%               rm
     0.00%              sed
     0.00%   git-diff-files
     0.00%             bash
     0.00%   git-diff-index
The column on the left shows the relative frequency of the samples. This output shows that make spends most of this time in xsltproc and the pdfxmltex. To reduce the time for the make to complete, focus on xsltproc and pdfxmltex. To list of the functions executed by xsltproc, run:
perf report -n --comm=xsltproc
This would generate:
comm: xsltproc
# Samples: 472520675377
#
# Overhead  Samples                    Shared Object  Symbol
# ........ ..........  .............................  ......
#
    45.54%215179861044  libxml2.so.2.7.6               [.] xmlXPathCmpNodesExt
    11.63%54959620202  libxml2.so.2.7.6               [.] xmlXPathNodeSetAdd__internal_alias
     8.60%40634845107  libxml2.so.2.7.6               [.] xmlXPathCompOpEval
     4.63%21864091080  libxml2.so.2.7.6               [.] xmlXPathReleaseObject
     2.73%12919672281  libxml2.so.2.7.6               [.] xmlXPathNodeSetSort__internal_alias
     2.60%12271959697  libxml2.so.2.7.6               [.] valuePop
     2.41%11379910918  libxml2.so.2.7.6               [.] xmlXPathIsNaN__internal_alias
     2.19%10340901937  libxml2.so.2.7.6               [.] valuePush__internal_alias

6.7. ftrace

The ftrace framework provides users with several tracing capabilities, accessible through an interface much simpler than SystemTap's. This framework uses a set of virtual files in the debugfs file system; these files enable specific tracers. The ftrace function tracer simply outputs each function called in the kernel in real time; other tracers within the ftrace framework can also be used to analyze wakeup latency, task switches, kernel events, and the like.
You can also add new tracers for ftrace, making it a flexible solution for analyzing kernel events. The ftrace framework is useful for debugging or analyzing latencies and performance issues that take place outside of user-space. Unlike other profilers documented in this guide, ftrace is a built-in feature of the kernel.

6.7.1. Using ftrace

The Red Hat Enterprise Linux 6 kernels have been configured with the CONFIG_FTRACE=y option. This option provides the interfaces needed by ftrace. To use ftrace, mount the debugfs file system as follows:
mount -t debugfs nodev /sys/kernel/debug
All the ftrace utilities are located in /sys/kernel/debug/tracing/. View the /sys/kernel/debug/tracing/available_tracers file to find out what tracers are available for your kernel:
cat /sys/kernel/debug/tracing/available_tracers
power wakeup irqsoff function sysprof sched_switch initcall nop
To use a specific tracer, write it to /sys/kernel/debug/tracing/current_tracer. For example, wakeup traces and records the maximum time it takes for the highest-priority task to be scheduled after the task wakes up. To use it:
echo wakeup > /sys/kernel/debug/tracing/current_tracer
To start or stop tracing, write to /sys/kernel/debug/tracing/tracing_on, as in:
echo 1 > /sys/kernel/debug/tracing/tracing_on (enables tracing)
echo 0 > /sys/kernel/debug/tracing/tracing_on (disables tracing)
The results of the trace can be viewed from the following files:
/sys/kernel/debug/tracing/trace
This file contains human-readable trace output.
/sys/kernel/debug/tracing/trace_pipe
This file contains the same output as /sys/kernel/debug/tracing/trace, but is meant to be piped into a command. Unlike /sys/kernel/debug/tracing/trace, reading from this file consumes its output.

6.7.2. ftrace Documentation

The ftrace framework is fully documented in the following files:
  • ftrace - Function Tracer: file:///usr/share/doc/kernel-doc-version/Documentation/trace/ftrace.txt
  • function tracer guts: file:///usr/share/doc/kernel-doc-version/Documentation/trace/ftrace-design.txt

Revision History

Revision History
Revision 1.0Thu Oct 08 2009Don Domingo
draft push

Index

Symbols

.spec file
specfile Editor
compiling and building, Eclipse Built-in Specfile Editor

A

added locales
GNU C Library
libraries and runtime support, GNU C Library Updates
advantages
Python pretty-printers
debugging, Python Pretty-Printers
Aggregate view
profiling
Eclipse-Callgraph, The Callgraph View
Akonadi
KDE Development Framework
libraries and runtime support, KDE4 Architecture
architecture, KDE4
KDE Development Framework
libraries and runtime support, KDE4 Architecture
authorizing compile servers for connection
SSL and certificate management
SystemTap, Authorizing Compile Servers for Connection
automatic authorization
SSL and certificate management
SystemTap, Automatic Authorization
Autotools
compiling and building, Autotools

B

backtrace
tools
GNU debugger, Simple GDB
Boost
libraries and runtime support, Boost
boost-doc
Boost
libraries and runtime support, Boost Documentation
breakpoint
fundamentals
GNU debugger, Simple GDB
breakpoints (conditional)
GNU debugger, Conditional Breakpoints
build integration
development toolkits
Eclipse, Development Toolkits
building
compiling and building, Compiling and Building

C

C++ Standard Library, GNU
libraries and runtime support, The GNU C++ Standard Library
C++0x, added support for
GNU C++ Standard Library
libraries and runtime support, GNU C++ Standard Library Updates
C/C++ Development Toolkit
development toolkits
Eclipse, Development Toolkits
cachegrind
tools
Valgrind, Valgrind Tools
Callgraph
plug-in for Eclipse
Eclipse-Callgraph, Eclipse-Callgraph
Callgraph View
profiling
Eclipse-Callgraph, The Callgraph View
callgrind
tools
Valgrind, Valgrind Tools
CDT
development toolkits
Eclipse, Development Toolkits
certificate management
SSL and certificate management
SystemTap, SSL and Certificate Management
checking functions (new)
GNU C Library
libraries and runtime support, GNU C Library Updates
Code Completion
libhover
libraries and runtime support, Setup and Usage
Collapse mode
profiling
Eclipse-Callgraph, The Callgraph View
Command Group Availability Tab
integrated development environment
Eclipse, The quick access menu
commands
fundamentals
GNU debugger, Simple GDB
profiling
Valgrind, Valgrind Tools
tools
Performance Counters for Linux (PCL) and perf, Perf Tool Commands
commonly-used commands
Autotools
compiling and building, Autotools
compatibility
libraries and runtime support, Compatibility
compile server
SystemTap, SystemTap Compile Server
compiling a C Hello World program
usage
GCC, Simple C Usage
compiling a C++ Hello World program
usage
GCC, Simple C++ Usage
compiling and building
Autotools, Autotools
commonly-used commands, Autotools
configuration script, Configuration Script
documentation, Autotools Documentation
plug-in for Eclipse, Autotools Plug-in for Eclipse
templates (supported), Autotools Plug-in for Eclipse
distributed compiling, Distributed Compiling
GNU Compiler Collection, GNU Compiler Collection (GCC)
documentation, GCC Documentation
required packages, Running GCC
usage, Running GCC
introduction, Compiling and Building
required packages, Distributed Compiling
specfile Editor, Eclipse Built-in Specfile Editor
plug-in for Eclipse, Eclipse Built-in Specfile Editor
conditional breakpoints
GNU debugger, Conditional Breakpoints
configuration script
Autotools
compiling and building, Configuration Script
configuring keyboard shortcuts
integrated development environment
Eclipse, The quick access menu
connection authorization (compile servers)
SSL and certificate management
SystemTap, Authorizing Compile Servers for Connection
Console View
user interface
Eclipse, User Interface
Contents (Help Contents)
Help system
Eclipse, Help In Eclipse
continue
tools
GNU debugger, Simple GDB
Customize Perspective Menu
integrated development environment
Eclipse, The quick access menu

D

debugfs file system
profiling
ftrace, ftrace
debugging
debuginfo-packages, Installing Debuginfo Packages
installation, Installing Debuginfo Packages
GNU debugger, GDB
fundamental mechanisms, GDB
GDB, GDB
requirements, GDB
introduction, Debugging
Python pretty-printers, Python Pretty-Printers
advantages, Python Pretty-Printers
debugging output (formatted), Python Pretty-Printers
documentation, Python Pretty-Printers
pretty-printers, Python Pretty-Printers
variable tracking at assignments (VTA), Variable Tracking at Assignments
debugging a Hello World program
usage
GNU debugger, Running GDB
debugging output (formatted)
Python pretty-printers
debugging, Python Pretty-Printers
debuginfo-packages
debugging, Installing Debuginfo Packages
default
user interface
Eclipse, User Interface
development toolkits
Eclipse, Development Toolkits
distributed compiling
compiling and building, Distributed Compiling
documentation
Autotools
compiling and building, Autotools Documentation
Boost
libraries and runtime support, Boost Documentation
GNU C Library
libraries and runtime support, GNU C Library Documentation
GNU C++ Standard Library
libraries and runtime support, GNU C++ Standard Library Documentation
GNU Compiler Collection
compiling and building, GCC Documentation
GNU debugger, GDB Documentation
Java
libraries and runtime support, Java Documentation
KDE Development Framework
libraries and runtime support, kdelibs Documentation
OProfile
profiling, OProfile Documentation
Perl
libraries and runtime support, Perl Documentation
profiling
ftrace, ftrace Documentation
Python
libraries and runtime support, Python Documentation
Python pretty-printers
debugging, Python Pretty-Printers
Qt
libraries and runtime support, Qt Library Documentation
Ruby
libraries and runtime support, Ruby Documentation
SystemTap
profiling, SystemTap Documentation
Valgrind
profiling, Valgrind Documentation
DTK (development toolkits)
development toolkits
Eclipse, Development Toolkits
Dynamic Help
Help system
Eclipse, Help In Eclipse

E

Eclipse
development toolkits, Development Toolkits
build integration, Development Toolkits
C/C++ Development Toolkit, Development Toolkits
CDT, Development Toolkits
DTK (development toolkits), Development Toolkits
hot patch, Development Toolkits
Java Development Toolkit, Development Toolkits
JDT, Development Toolkits
Help system, Help In Eclipse
Contents (Help Contents), Help In Eclipse
Dynamic Help, Help In Eclipse
Menu (Help Menu), Help In Eclipse
Workbench User Guide, Help In Eclipse
integrated development environment, The Eclipse Integrated Development Environment (IDE)
Command Group Availability Tab, The quick access menu
configuring keyboard shortcuts, The quick access menu
Customize Perspective Menu, The quick access menu
IDE (integrated development environment), The Eclipse Integrated Development Environment (IDE)
Keyboard Shortcuts Menu, The quick access menu
menu (Main Menu), The Eclipse Integrated Development Environment (IDE)
Menu Visibility Tab, The quick access menu
perspectives, The Eclipse Integrated Development Environment (IDE)
Quick Access Menu, The quick access menu
Shortcuts Tab, The quick access menu
Tool Bar Visibility, The quick access menu
useful hints, Useful Hints
user interface, User Interface
workbench, The Eclipse Integrated Development Environment (IDE)
introduction, Introduction to Eclipse
libhover
libraries and runtime support, libhover Plug-in
profiling, Profiling In Eclipse
projects, Understanding Eclipse Projects
New Project Wizard, Understanding Eclipse Projects
technical overview, Understanding Eclipse Projects
workspace (overview), Understanding Eclipse Projects
Workspace Launcher, Understanding Eclipse Projects
user interface
Console View, User Interface
default, User Interface
Editor, User Interface
Outline Window, User Interface
Problems View, User Interface
Project Explorer, User Interface
quick fix (Problems View), User Interface
Tasks Properties, User Interface
Tasks View, User Interface
tracked comments, User Interface
View Menu (button), User Interface
Eclipse-Callgraph
plug-in for Eclipse, Eclipse-Callgraph
Callgraph, Eclipse-Callgraph
profiling, Eclipse-Callgraph
profiling
Aggregate view, The Callgraph View
Callgraph View, The Callgraph View
Collapse mode, The Callgraph View
Go to Code, The Callgraph View
Level view, The Callgraph View
Radial view, The Callgraph View
SystemTap, Eclipse-Callgraph
Thumbnail viewer, The Callgraph View
Tree view, The Callgraph View
usage, Launching a Profile With Eclipse-Callgraph
Editor
user interface
Eclipse, User Interface
Emacs and GDB
GNU debugger, GDB Variations and Environments
execution (forked)
GNU debugger, Forked Execution

F

feedback
contact information for this manual, We Need Feedback!
finish
tools
GNU debugger, Simple GDB
forked execution
GNU debugger, Forked Execution
formatted debugging output
Python pretty-printers
debugging, Python Pretty-Printers
framework (ftrace)
profiling
ftrace, ftrace
ftrace
profiling, ftrace
debugfs file system, ftrace
documentation, ftrace Documentation
framework (ftrace), ftrace
usage, Using ftrace
function tracer
profiling
ftrace, ftrace
fundamental commands
fundamentals
GNU debugger, Simple GDB
fundamental mechanisms
GNU debugger
debugging, GDB
fundamentals
GNU debugger, Simple GDB

G

gcc
GNU Compiler Collection
compiling and building, GNU Compiler Collection (GCC)
GCC C
usage
compiling a C Hello World program, Simple C Usage
GCC C++
usage
compiling a C++ Hello World program, Simple C++ Usage
GDB
GNU debugger
debugging, GDB
gem2rpm
Ruby
libraries and runtime support, gem2rpm
glibc
libraries and runtime support, The GNU C Library
GNU C Library
libraries and runtime support, The GNU C Library
GNU C++ Standard Library
libraries and runtime support, The GNU C++ Standard Library
GNU Compiler Collection
compiling and building, GNU Compiler Collection (GCC)
GNU debugger
conditional breakpoints, Conditional Breakpoints
debugging, GDB
documentation, GDB Documentation
Emacs and GDB, GDB Variations and Environments
execution (forked), Forked Execution
forked execution, Forked Execution
fundamentals, Simple GDB
breakpoint, Simple GDB
commands, Simple GDB
halting an executable, Simple GDB
inspecting the state of an executable, Simple GDB
starting an executable, Simple GDB
interfaces (CLI and machine), GDB Variations and Environments
thread and threaded debugging, Threads
tools, Simple GDB
backtrace, Simple GDB
continue, Simple GDB
finish, Simple GDB
help, Simple GDB
list, Simple GDB
next, Simple GDB
print, Simple GDB
quit, Simple GDB
step, Simple GDB
usage, Running GDB
debugging a Hello World program, Running GDB
variations and environments, GDB Variations and Environments
Go to Code
profiling
Eclipse-Callgraph, The Callgraph View

H

halting an executable
fundamentals
GNU debugger, Simple GDB
header files
GNU C Library
libraries and runtime support, The GNU C Library
helgrind
tools
Valgrind, Valgrind Tools
help
getting help, Do You Need Help?
tools
GNU debugger, Simple GDB
Help system
Eclipse, Help In Eclipse
hints
integrated development environment
Eclipse, Useful Hints
host (compile server host)
compile server
SystemTap, SystemTap Compile Server
hot patch
development toolkits
Eclipse, Development Toolkits
Hover Help
libhover
libraries and runtime support, Setup and Usage

I

IDE (integrated development environment)
integrated development environment
Eclipse, The Eclipse Integrated Development Environment (IDE)
indexing
libhover
libraries and runtime support, libhover Plug-in
inspecting the state of an executable
fundamentals
GNU debugger, Simple GDB
installation
debuginfo-packages
debugging, Installing Debuginfo Packages
integrated development environment
Eclipse, The Eclipse Integrated Development Environment (IDE)
interfaces (added new)
GNU C Library
libraries and runtime support, GNU C Library Updates
interfaces (CLI and machine)
GNU debugger, GDB Variations and Environments
introduction
compiling and building, Compiling and Building
debugging, Debugging
Eclipse, Introduction to Eclipse
libraries and runtime support, Libraries and Runtime Support
profiling, Profiling
SystemTap, SystemTap
ISO 14482 Standard C++ library
GNU C++ Standard Library
libraries and runtime support, The GNU C++ Standard Library
ISO C++ TR1 elements, added support for
GNU C++ Standard Library
libraries and runtime support, GNU C++ Standard Library Updates

J

Java
libraries and runtime support, Java
Java Development Toolkit
development toolkits
Eclipse, Development Toolkits
JDT
development toolkits
Eclipse, Development Toolkits

K

KDE Development Framework
libraries and runtime support, KDE Development Framework
KDE4 architecture
KDE Development Framework
libraries and runtime support, KDE4 Architecture
kdelibs-devel
KDE Development Framework
libraries and runtime support, KDE Development Framework
kernel information packages
profiling
SystemTap, SystemTap
Keyboard Shortcuts Menu
integrated development environment
Eclipse, The quick access menu
KHTML
KDE Development Framework
libraries and runtime support, KDE4 Architecture
KIO
KDE Development Framework
libraries and runtime support, KDE4 Architecture
KJS
KDE Development Framework
libraries and runtime support, KDE4 Architecture
KNewStuff2
KDE Development Framework
libraries and runtime support, KDE4 Architecture
KXMLGUI
KDE Development Framework
libraries and runtime support, KDE4 Architecture

L

Level view
profiling
Eclipse-Callgraph, The Callgraph View
libhover
libraries and runtime support, libhover Plug-in
libraries
runtime support, Libraries and Runtime Support
libraries and runtime support
Boost, Boost
boost-doc, Boost Documentation
documentation, Boost Documentation
message passing interface (MPI), Boost
meta-package, Boost
MPICH2, Boost
new libraries, Boost Updates
Open MPI, Boost
sub-packages, Boost
updates, Boost Updates
C++ Standard Library, GNU, The GNU C++ Standard Library
compatibility, Compatibility
glibc, The GNU C Library
GNU C Library, The GNU C Library
added new interfaces, GNU C Library Updates
checking functions (new), GNU C Library Updates
documentation, GNU C Library Documentation
header files, The GNU C Library
interfaces (added new), GNU C Library Updates
Linux-specific interfaces (added), GNU C Library Updates
locales (added), GNU C Library Updates
updates, GNU C Library Updates
GNU C++ Standard Library, The GNU C++ Standard Library
C++0x, added support for, GNU C++ Standard Library Updates
documentation, GNU C++ Standard Library Documentation
ISO 14482 Standard C++ library, The GNU C++ Standard Library
ISO C++ TR1 elements, added support for, GNU C++ Standard Library Updates
libstdc++-devel, The GNU C++ Standard Library
libstdc++-docs, GNU C++ Standard Library Documentation
Standard Template Library, The GNU C++ Standard Library
updates, GNU C++ Standard Library Updates
introduction, Libraries and Runtime Support
Java, Java
documentation, Java Documentation
KDE Development Framework, KDE Development Framework
Akonadi, KDE4 Architecture
documentation, kdelibs Documentation
KDE4 architecture, KDE4 Architecture
kdelibs-devel, KDE Development Framework
KHTML, KDE4 Architecture
KIO, KDE4 Architecture
KJS, KDE4 Architecture
KNewStuff2, KDE4 Architecture
KXMLGUI, KDE4 Architecture
Phonon, KDE4 Architecture
Plasma, KDE4 Architecture
Solid, KDE4 Architecture
Sonnet, KDE4 Architecture
Strigi, KDE4 Architecture
Telepathy, KDE4 Architecture
libhover, libhover Plug-in
Code Completion, Setup and Usage
Eclipse, libhover Plug-in
Hover Help, Setup and Usage
indexing, libhover Plug-in
usage, Setup and Usage
libstdc++, The GNU C++ Standard Library
Perl, Perl
documentation, Perl Documentation
module installation, Installation
updates, Perl Updates
Python, Python
documentation, Python Documentation
updates, Python Updates
Qt, Qt
documentation, Qt Library Documentation
meta object compiler (MOC), Qt
Qt Creator, Qt Creator
qt-doc, Qt Library Documentation
updates, Qt Updates
widget toolkit, Qt
Ruby, Ruby
documentation, Ruby Documentation
gem2rpm, gem2rpm
ruby-devel, Ruby
libstdc++
libraries and runtime support, The GNU C++ Standard Library
libstdc++-devel
GNU C++ Standard Library
libraries and runtime support, The GNU C++ Standard Library
libstdc++-docs
GNU C++ Standard Library
libraries and runtime support, GNU C++ Standard Library Documentation
Linux-specific interfaces (added)
GNU C Library
libraries and runtime support, GNU C Library Updates
list
tools
GNU debugger, Simple GDB
Performance Counters for Linux (PCL) and perf, Perf Tool Commands
locales (added)
GNU C Library
libraries and runtime support, GNU C Library Updates

M

machine interface
GNU debugger, GDB Variations and Environments
massif
tools
Valgrind, Valgrind Tools
mechanisms
GNU debugger
debugging, GDB
memcheck
tools
Valgrind, Valgrind Tools
Menu (Help Menu)
Help system
Eclipse, Help In Eclipse
menu (Main Menu)
integrated development environment
Eclipse, The Eclipse Integrated Development Environment (IDE)
Menu Visibility Tab
integrated development environment
Eclipse, The quick access menu
message passing interface (MPI)
Boost
libraries and runtime support, Boost
meta object compiler (MOC)
Qt
libraries and runtime support, Qt
meta-package
Boost
libraries and runtime support, Boost
module installation
Perl
libraries and runtime support, Installation
module signing (compile server authorization)
SSL and certificate management
SystemTap, Authorizing Compile Servers for Module Signing (for Unprivileged Users)
MPICH2
Boost
libraries and runtime support, Boost

N

new extensions
GNU C++ Standard Library
libraries and runtime support, GNU C++ Standard Library Updates
new libraries
Boost
libraries and runtime support, Boost Updates
New Project Wizard
projects
Eclipse, Understanding Eclipse Projects
next
tools
GNU debugger, Simple GDB

O

opannotate
tools
OProfile, OProfile Tools
oparchive
tools
OProfile, OProfile Tools
opcontrol
tools
OProfile, OProfile Tools
Open MPI
Boost
libraries and runtime support, Boost
opgprof
tools
OProfile, OProfile Tools
opreport
tools
OProfile, OProfile Tools
OProfile
profiling, OProfile
documentation, OProfile Documentation
usage, Using OProfile
tools, OProfile Tools
opannotate, OProfile Tools
oparchive, OProfile Tools
opcontrol, OProfile Tools
opgprof, OProfile Tools
opreport, OProfile Tools
oprofiled
OProfile
profiling, OProfile
Outline Window
user interface
Eclipse, User Interface

P

perf
profiling
Performance Counters for Linux (PCL) and perf, Performance Counters for Linux (PCL) Tools and perf
usage
Performance Counters for Linux (PCL) and perf, Using Perf
Performance Counters for Linux (PCL) and perf
profiling, Performance Counters for Linux (PCL) Tools and perf
subsystem (PCL), Performance Counters for Linux (PCL) Tools and perf
tools, Perf Tool Commands
commands, Perf Tool Commands
list, Perf Tool Commands
record, Perf Tool Commands
report, Perf Tool Commands
stat, Perf Tool Commands
usage, Using Perf
perf, Using Perf
Perl
libraries and runtime support, Perl
perspectives
integrated development environment
Eclipse, The Eclipse Integrated Development Environment (IDE)
Phonon
KDE Development Framework
libraries and runtime support, KDE4 Architecture
Plasma
KDE Development Framework
libraries and runtime support, KDE4 Architecture
plug-in for Eclipse
Autotools
compiling and building, Autotools Plug-in for Eclipse
Eclipse-Callgraph, Eclipse-Callgraph
profiling
Valgrind, Valgrind Plug-in for Eclipse
specfile Editor
compiling and building, Eclipse Built-in Specfile Editor
pretty-printers
Python pretty-printers
debugging, Python Pretty-Printers
print
tools
GNU debugger, Simple GDB
Problems View
user interface
Eclipse, User Interface
Profile As
Eclipse
profiling, Profiling In Eclipse
Profile Configuration Menu
Eclipse
profiling, Profiling In Eclipse
profiling
Eclipse, Profiling In Eclipse
Profile As, Profiling In Eclipse
Profile Configuration Menu, Profiling In Eclipse
ftrace, ftrace
introduction, Profiling
OProfile, OProfile
oprofiled, OProfile
Performance Counters for Linux (PCL) and perf, Performance Counters for Linux (PCL) Tools and perf
plug-in for Eclipse
Eclipse-Callgraph, Eclipse-Callgraph
SystemTap, SystemTap
Valgrind, Valgrind
Project Explorer
user interface
Eclipse, User Interface
projects
Eclipse, Understanding Eclipse Projects
Python
libraries and runtime support, Python
Python pretty-printers
debugging, Python Pretty-Printers

Q

Qt
libraries and runtime support, Qt
Qt Creator
Qt
libraries and runtime support, Qt Creator
qt-doc
Qt
libraries and runtime support, Qt Library Documentation
Quick Access Menu
integrated development environment
Eclipse, The quick access menu
quick fix (Problems View)
user interface
Eclipse, User Interface
quit
tools
GNU debugger, Simple GDB

R

Radial view
profiling
Eclipse-Callgraph, The Callgraph View
record
tools
Performance Counters for Linux (PCL) and perf, Perf Tool Commands
report
tools
Performance Counters for Linux (PCL) and perf, Perf Tool Commands
required packages
compiling and building, Distributed Compiling
GNU Compiler Collection
compiling and building, Running GCC
profiling
SystemTap, SystemTap
requirements
GNU debugger
debugging, GDB
Ruby
libraries and runtime support, Ruby
ruby-devel
Ruby
libraries and runtime support, Ruby
runtime support
libraries, Libraries and Runtime Support

S

scripts (SystemTap scripts)
profiling
SystemTap, SystemTap
setup
libhover
libraries and runtime support, Setup and Usage
Shortcuts Tab
integrated development environment
Eclipse, The quick access menu
signed modules
SSL and certificate management
SystemTap, Authorizing Compile Servers for Module Signing (for Unprivileged Users)
unprivileged user support
SystemTap, SystemTap Support for Unprivileged Users
Solid
KDE Development Framework
libraries and runtime support, KDE4 Architecture
Sonnet
KDE Development Framework
libraries and runtime support, KDE4 Architecture
specfile Editor
compiling and building, Eclipse Built-in Specfile Editor
SSL and certificate management
SystemTap, SSL and Certificate Management
Standard Template Library
GNU C++ Standard Library
libraries and runtime support, The GNU C++ Standard Library
starting an executable
fundamentals
GNU debugger, Simple GDB
stat
tools
Performance Counters for Linux (PCL) and perf, Perf Tool Commands
step
tools
GNU debugger, Simple GDB
Strigi
KDE Development Framework
libraries and runtime support, KDE4 Architecture
sub-packages
Boost
libraries and runtime support, Boost
subsystem (PCL)
profiling
Performance Counters for Linux (PCL) and perf, Performance Counters for Linux (PCL) Tools and perf
supported templates
Autotools
compiling and building, Autotools Plug-in for Eclipse
SystemTap
compile server, SystemTap Compile Server
host (compile server host), SystemTap Compile Server
profiling, SystemTap
documentation, SystemTap Documentation
Eclipse-Callgraph, Eclipse-Callgraph
introduction, SystemTap
kernel information packages, SystemTap
required packages, SystemTap
scripts (SystemTap scripts), SystemTap
SSL and certificate management, SSL and Certificate Management
automatic authorization, Automatic Authorization
connection authorization (compile servers), Authorizing Compile Servers for Connection
module signing (compile server authorization), Authorizing Compile Servers for Module Signing (for Unprivileged Users)
unprivileged user support, SystemTap Support for Unprivileged Users
signed modules, SystemTap Support for Unprivileged Users

T

Tasks Properties
user interface
Eclipse, User Interface
Tasks View
user interface
Eclipse, User Interface
technical overview
projects
Eclipse, Understanding Eclipse Projects
Telepathy
KDE Development Framework
libraries and runtime support, KDE4 Architecture
templates (supported)
Autotools
compiling and building, Autotools Plug-in for Eclipse
thread and threaded debugging
GNU debugger, Threads
Thumbnail viewer
profiling
Eclipse-Callgraph, The Callgraph View
Tool Bar Visibility
integrated development environment
Eclipse, The quick access menu
tools
GNU debugger, Simple GDB
OProfile, OProfile Tools
Performance Counters for Linux (PCL) and perf, Perf Tool Commands
profiling
Valgrind, Valgrind Tools
tracked comments
user interface
Eclipse, User Interface
Tree view
profiling
Eclipse-Callgraph, The Callgraph View

U

unprivileged user support
SystemTap, SystemTap Support for Unprivileged Users
unprivileged users
unprivileged user support
SystemTap, SystemTap Support for Unprivileged Users
updates
Boost
libraries and runtime support, Boost Updates
GNU C Library
libraries and runtime support, GNU C Library Updates
GNU C++ Standard Library
libraries and runtime support, GNU C++ Standard Library Updates
Perl
libraries and runtime support, Perl Updates
Python
libraries and runtime support, Python Updates
Qt
libraries and runtime support, Qt Updates
usage
GNU Compiler Collection
compiling and building, Running GCC
GNU debugger, Running GDB
fundamentals, Simple GDB
libhover
libraries and runtime support, Setup and Usage
Performance Counters for Linux (PCL) and perf, Using Perf
profiling
Eclipse-Callgraph, Launching a Profile With Eclipse-Callgraph
ftrace, Using ftrace
OProfile, Using OProfile
Valgrind
profiling, Using Valgrind
useful hints
integrated development environment
Eclipse, Useful Hints
user interface
integrated development environment
Eclipse, User Interface

V

Valgrind
profiling, Valgrind
commands, Valgrind Tools
documentation, Valgrind Documentation
plug-in for Eclipse, Valgrind Plug-in for Eclipse
tools, Valgrind Tools
usage, Using Valgrind
tools
cachegrind, Valgrind Tools
callgrind, Valgrind Tools
helgrind, Valgrind Tools
massif, Valgrind Tools
memcheck, Valgrind Tools
variable tracking at assignments (VTA)
debugging, Variable Tracking at Assignments
variations and environments
GNU debugger, GDB Variations and Environments
View Menu (button)
user interface
Eclipse, User Interface
View, Callgraph
profiling
Eclipse-Callgraph, The Callgraph View

W

widget toolkit
Qt
libraries and runtime support, Qt
workbench
integrated development environment
Eclipse, The Eclipse Integrated Development Environment (IDE)
Workbench User Guide
Help system
Eclipse, Help In Eclipse
workspace (overview)
projects
Eclipse, Understanding Eclipse Projects
Workspace Launcher
projects
Eclipse, Understanding Eclipse Projects